


1.Introduction
Looker Studio (formerly Google Data Studio) is a free tool by Google for creating interactive, visually appealing dashboards and reports. It connects to various data sources like Google Analytics, Google Ads, Google Search Console, and third-party platforms, allowing real-time insights. With a user-friendly drag-and-drop interface, it simplifies data visualization and encourages collaboration through shareable reports. This SOP outlines the step-by-step process to create a structured eCommerce SEO Report in Looker Studio.
2.eCommerce SEO Report
The eCommerce SEO Report provides a comprehensive analysis of the website’s SEO performance, focusing on organic traffic growth, keyword rankings, and conversion optimization. It evaluates traffic sources, user behavior, and engagement metrics across different devices and regions. The report highlights the impact of SEO efforts by comparing pre- and post-implementation results, assessing key performance indicators such as:
Technical and content optimization opportunities
Organic traffic trends
Product and category page rankings
Conversion rates from organic search
Keyword performance
3. Detailed Procedure / Steps
Step 1: Set Up the Reporting Framework
- Log in to Looker Studio:
- Open Google Chrome and navigate to Looker Studio.
- Sign in with your Google account.
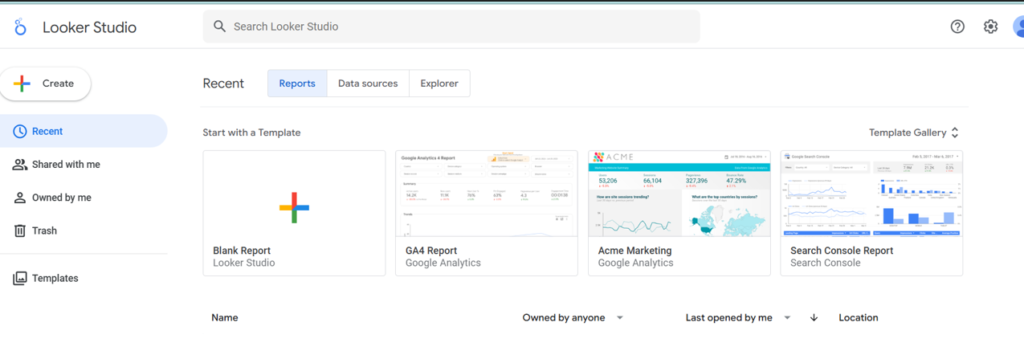
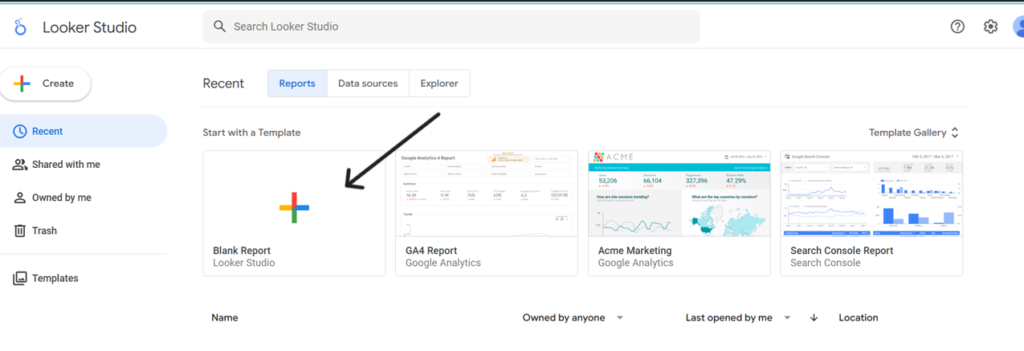
- Create a New Report:
- Click “Create” → “Report” in the top-left corner.
- Start with a blank canvas.
- Set Objectives:
- Define goals for the report (e.g., monitor SEO performance, analyze conversions, track e-commerce sales).
- List key metrics and dimensions to include:
- Metrics: Sessions, Conversion Rate, AOV (Average Order Value), Revenue.
- Dimensions: Time (monthly trends), Traffic Source, Device Type, Country.
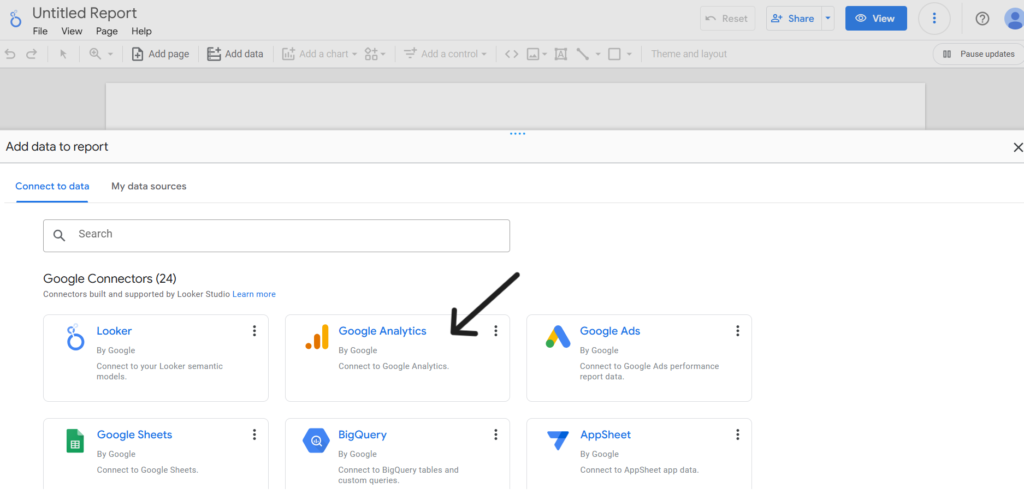
Step 2: Connect Data Sources
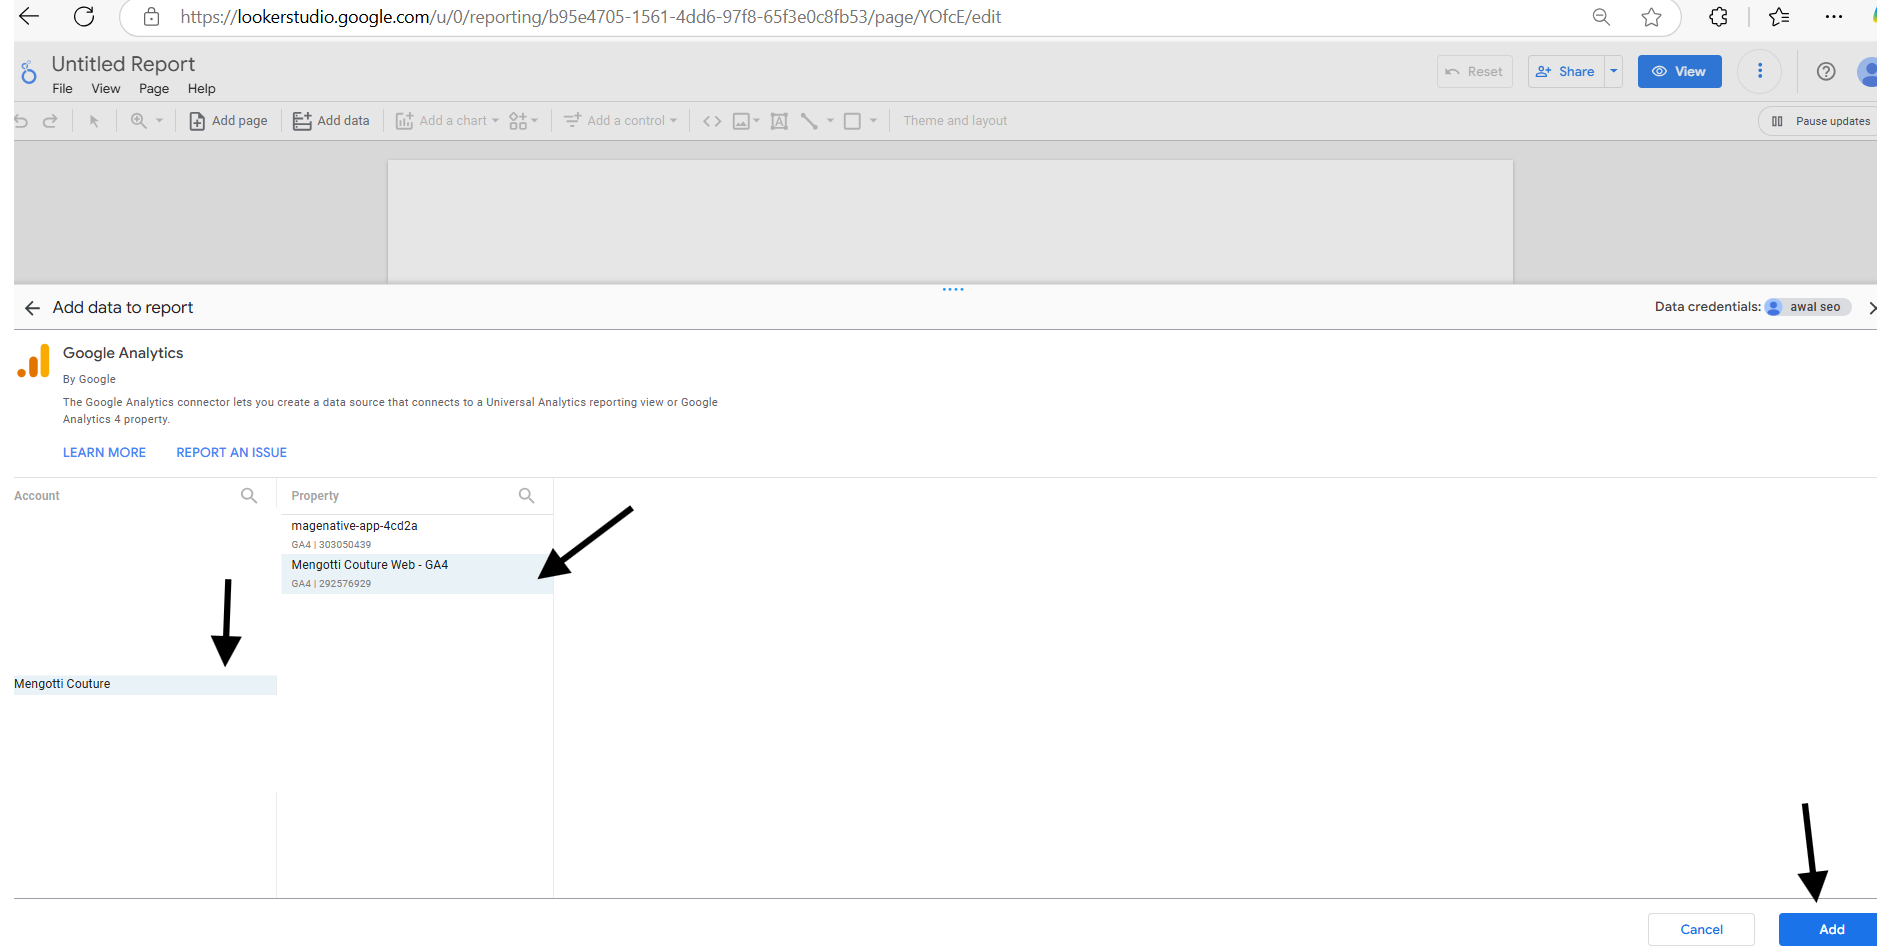
- Choose Data Stores:
- Click “Add Data” and select:
- Google Analytics 4: For website traffic, user behavior, and conversions.
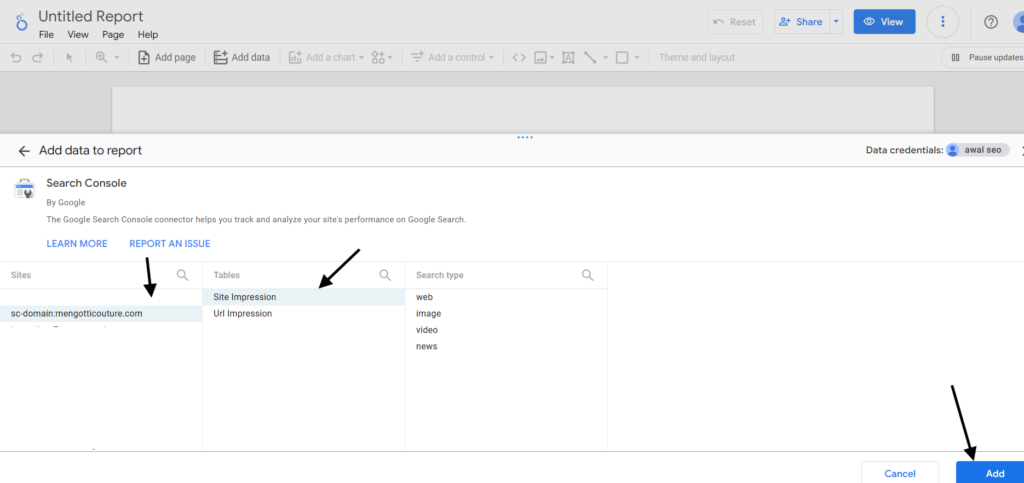
- Google Search Console: For organic traffic and clicks.
- Click “Add Data” and select:
- Authenticate Data:
- Log in to your Google and e-commerce accounts to allow data access.
- Verify Data:
- Ensure all required fields (e.g., Total Users, Sessions, Orders) are available.
Step 3: Design the Template
Create Layout:
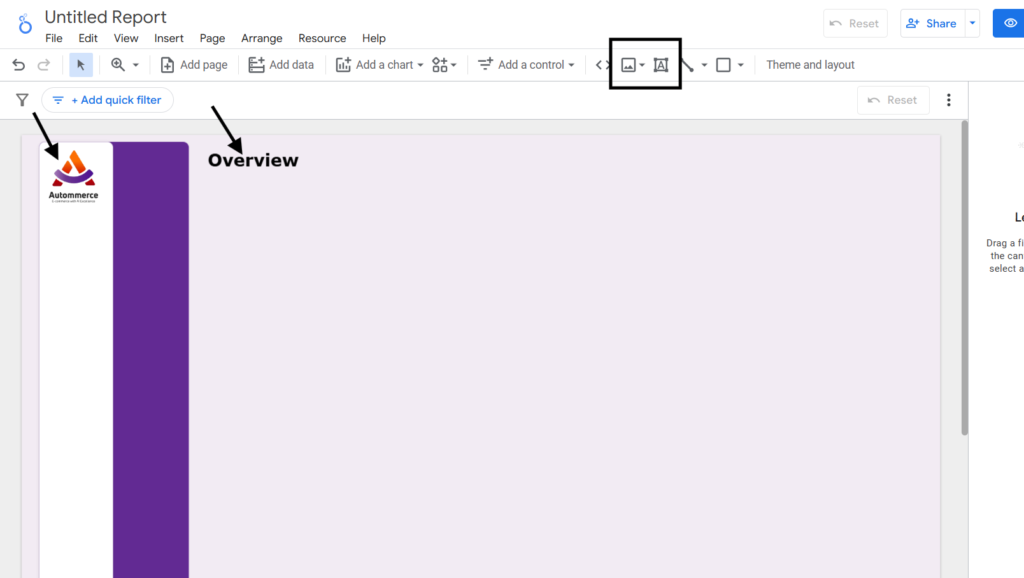
- Add Text Boxes for the title (“Website Performance Report”).
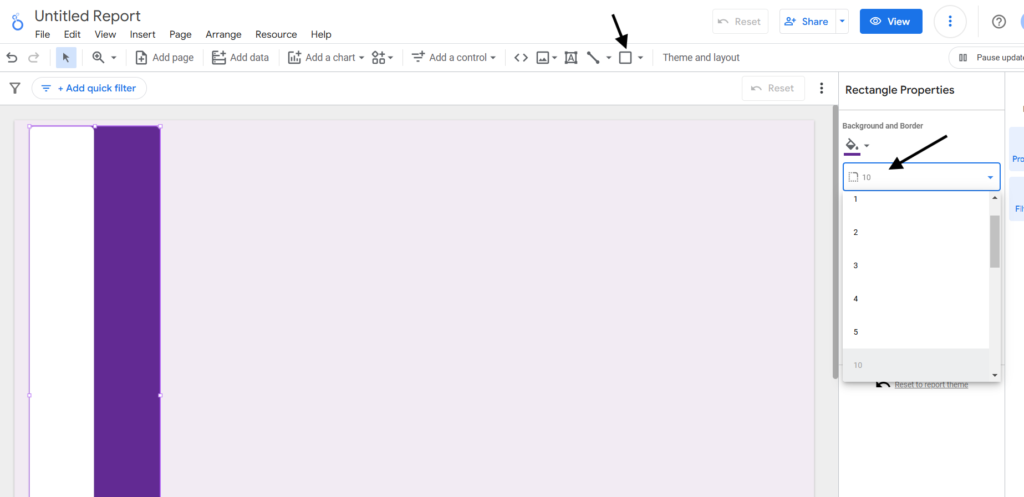
- Use Shapes or Lines to create sections (e.g., Overview, Traffic, Conversions).
- Add your company logo to the top-left corner.
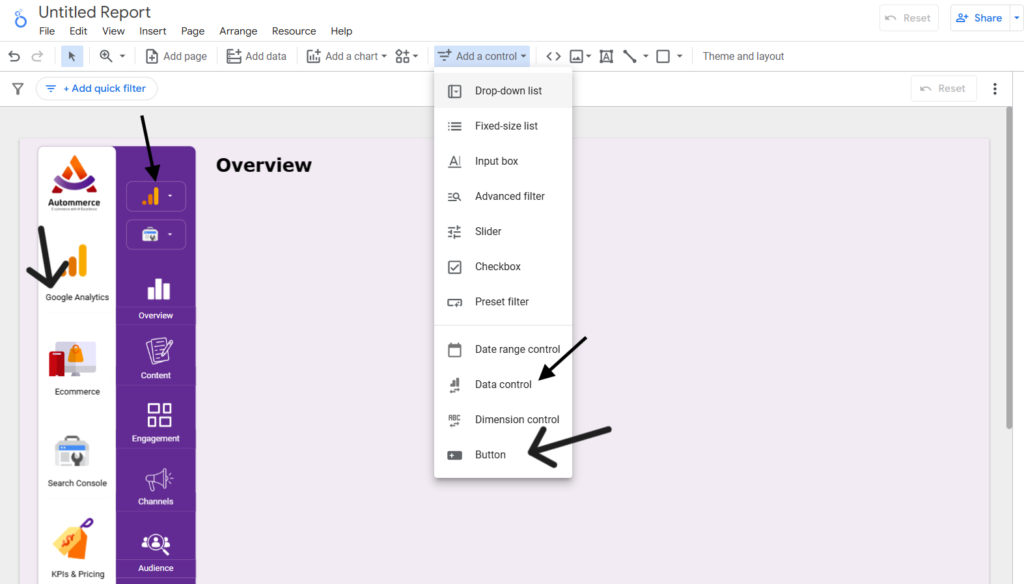
- Add Data Controls to change property.
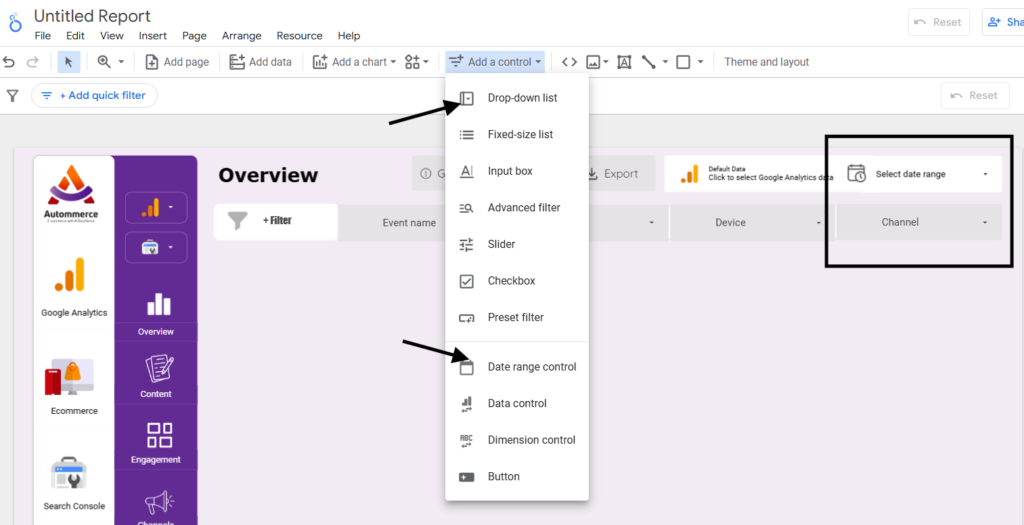
- Add drop down lists and date range control to filter data according to the dimension.
- Add buttons and link them to pages.
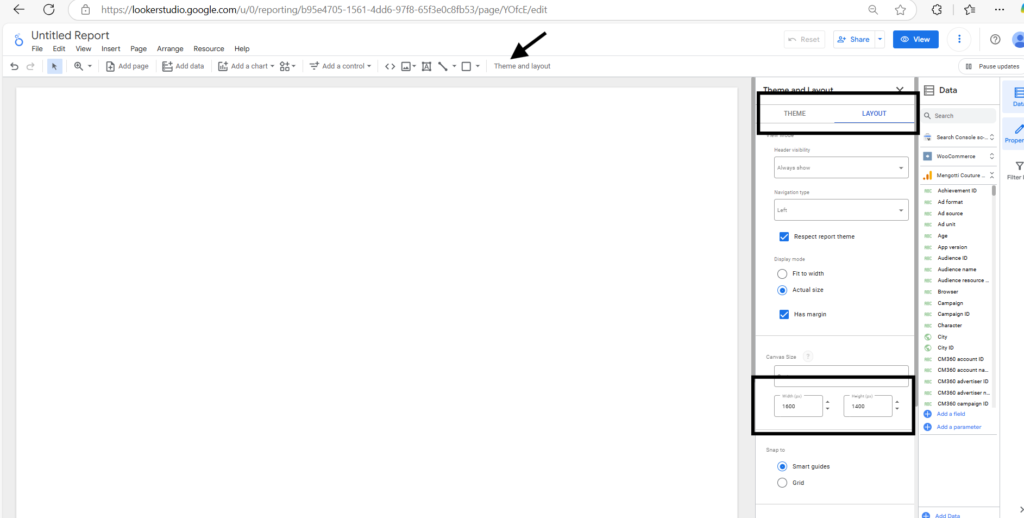
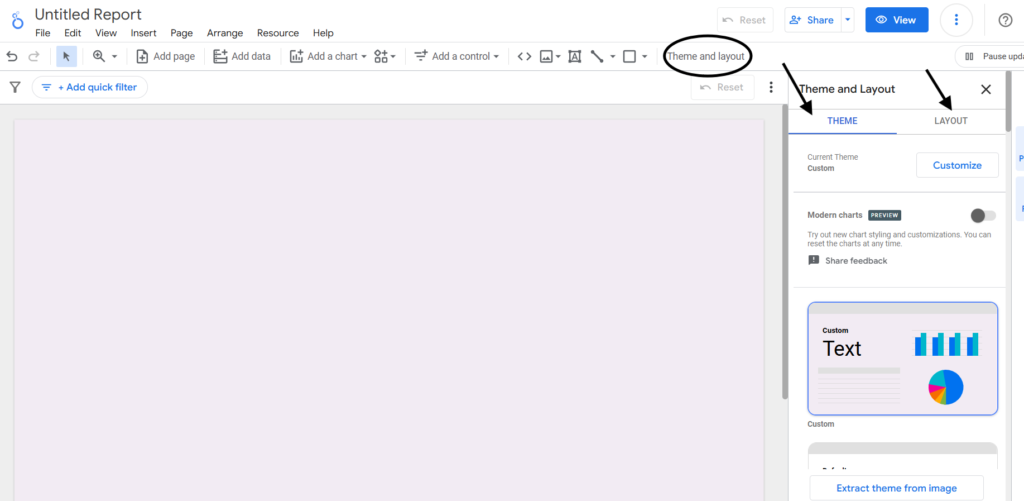
Style the Layout:
- Go to Theme and Layout to select colors and fonts that match your branding.
- Align and resize sections for consistency.
*For the whole charts assign the date as auto date range and comparison period (last period).
*For data control and date range control right click and click Make report-level in order if you change them in one page, the whole report will be affected.
GA4 Pages:
To streamline the GA4 analysis process and allow for deeper insights into key metrics, add six distinct buttons, each paired with an intuitive icon. These buttons should facilitate easy navigation and exploration of detailed analytics across different sections from GA4 data store.
*Drop down lists for GA4 pages are “Event name, Country, Device, and Channel which is mainly Session default channel group”.
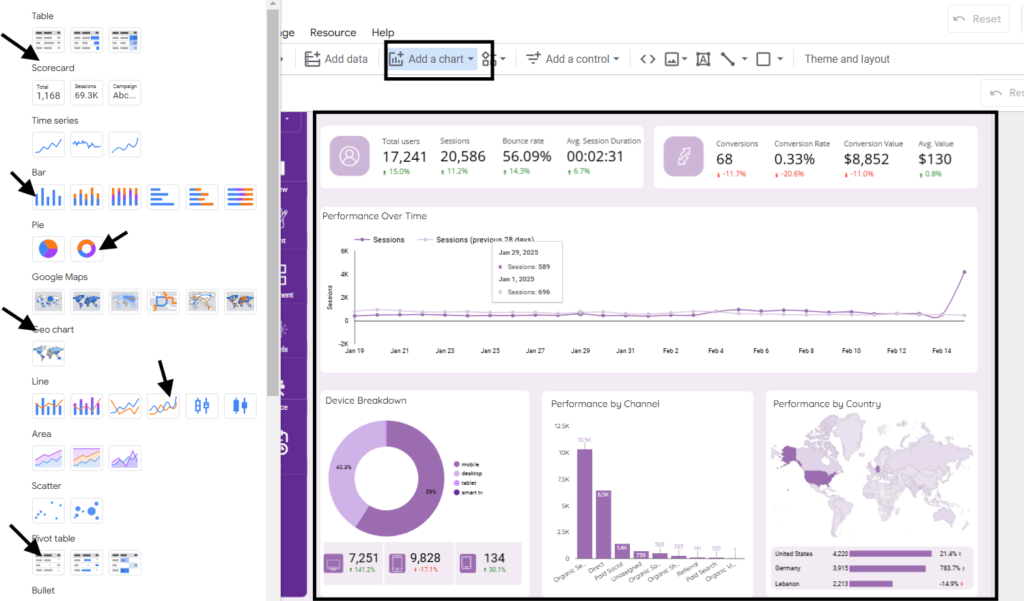
Overview Section
The Overview section provides a high-level summary of the website’s SEO performance, user behavior, and key eCommerce metrics.
- Scorecards with Key Metrics: Add scorecards in the Overview section to display key site performance metrics from Google Analytics 4 (GA4), providing a quick snapshot of the website’s SEO health.
- Total Users: The total number of unique users who visited the site.
- Sessions: The number of times users engaged with the site.
- Bounce Rate: The percentage of visitors who left the site after viewing only one page.
- Average Session Duration: The average length of a user’s session.
- Conversions: The number of completed actions (purchases, sign-ups, etc.) from organic traffic.
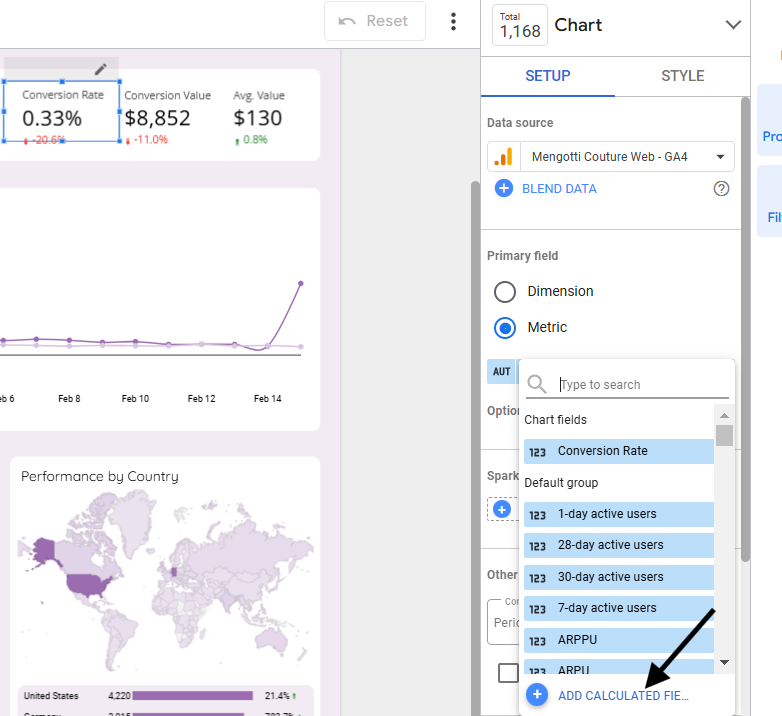
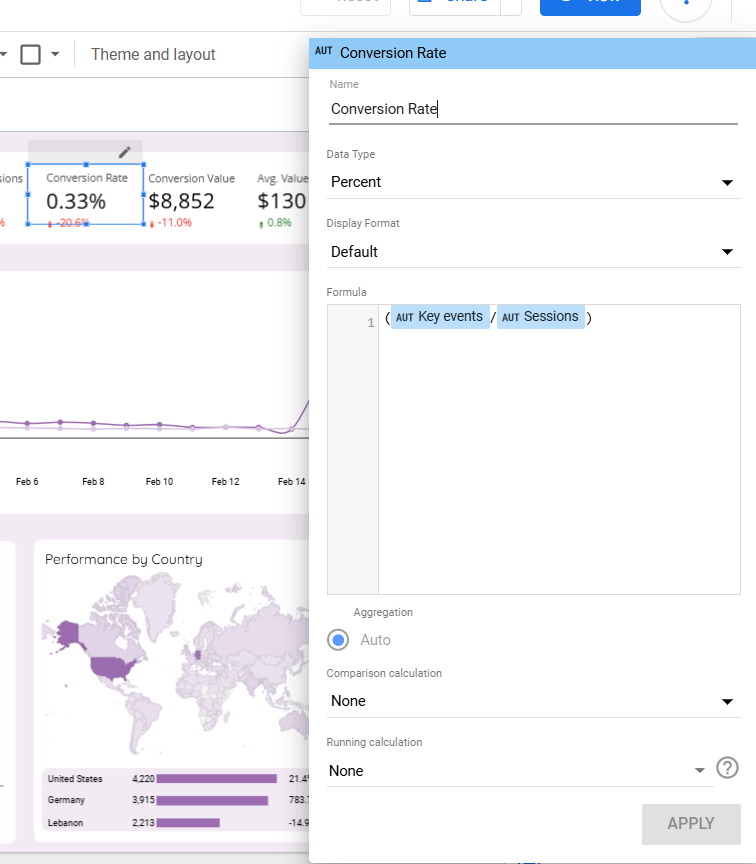
- Conversion Rate: The percentage of sessions that resulted in a conversion (create new field: Conversions / Sessions with data type: percent).
- Conversion Value: The total revenue generated from organic traffic conversions.
- Average Order Value (AOV): The average revenue per order from organic traffic (create new field: Total revenue / conversions with data type: Currency (USD).
- Visualizing Trends: Use line charts to display monthly trends for organic sessions and conversions.
- Device Breakdown: A donut chart illustrating the percentage of users by device type (mobile, desktop, tablet, smart TV).
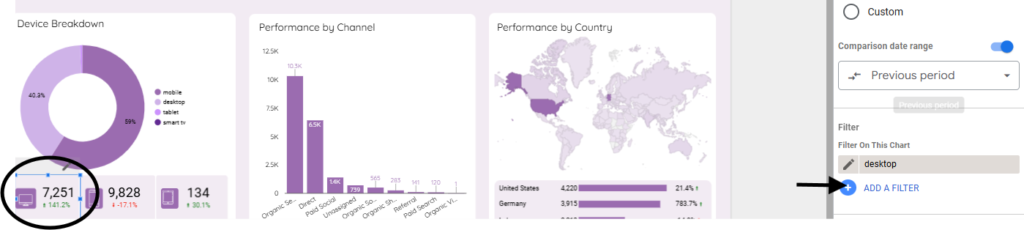
- Performance by Channel: A bar chart displaying traffic volume from different channels (organic search, direct, paid, referral, social, etc.) / create 3 filters for the 3 scorecards below the chart (include Device category equals: desktop / mobile / tablet)
- Performance by Country: A geographic heatmap showcasing traffic distribution across key regions with small table with one metric (sessions) below heatmap.
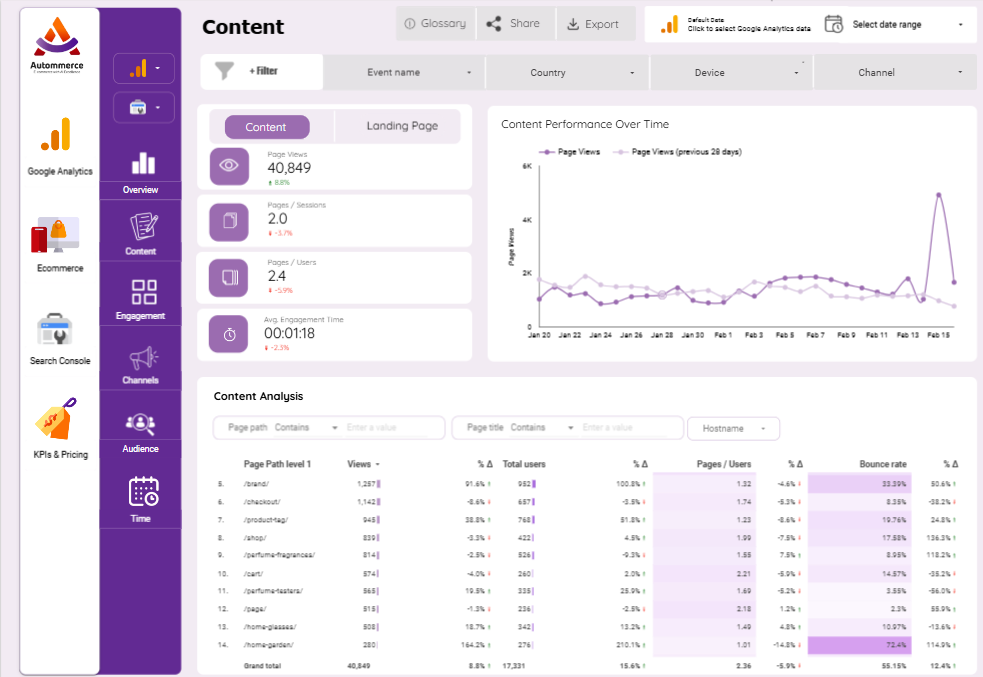
Content Section: Divided into two tabs
Content tab:
The Content tab provides insights into the overall performance of landing pages and product pages, analyzing how users interact with site content and identifying optimization opportunities. The section includes the following key metrics and visuals:
- Content Performance Scorecards:
- Page Views: The total number of page views across all tracked content.
- Pages per Session: The average number of pages a user visits per session (new field: views / sessions).
- Pages per User: The average number of pages viewed per unique visitor (new field: views / Total users).
- Average Engagement Time: The average time users actively engage with the content (new filed: User Engagement / Engaged Sessions).
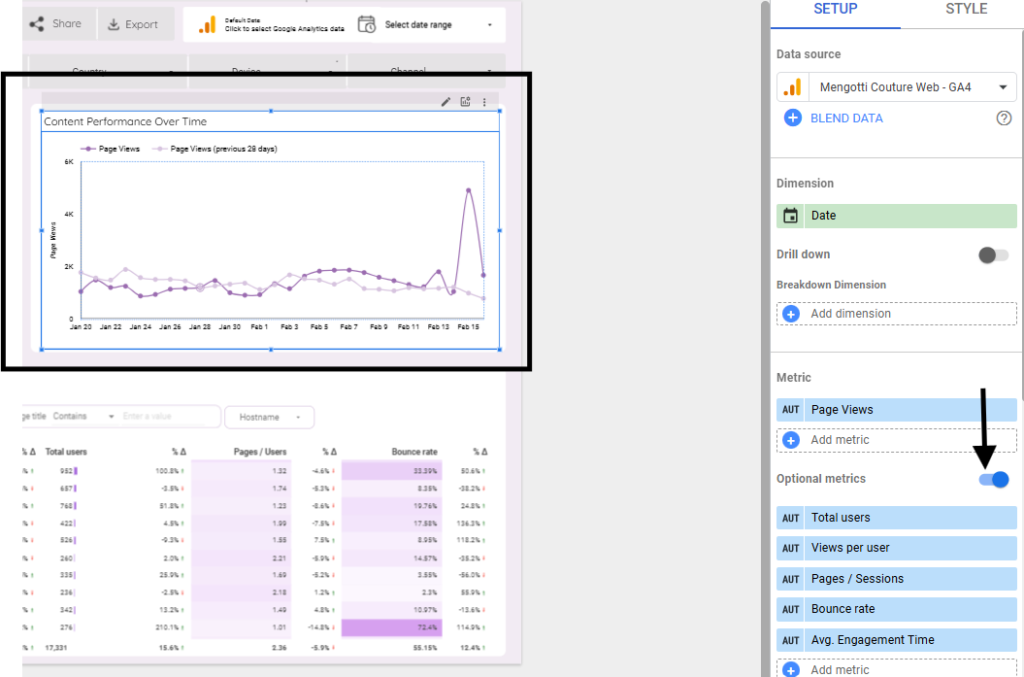
- Content Performance Over Time:
- A line chart displaying trends in page views over a specified period (add optional metrics).
- Comparison with the previous period to measure content growth.
- Content Analysis Table:
- Page Path Level 1: A structured breakdown of page performance based on URL path.
- Views & Total Users
- Pages per User
- Bounce Rate
- Sorting and filtering options allow users to analyze specific content sections, such as product pages, checkout pages, or blog posts.
- Engagement Metrics:
- Identifies high-performing content that retains users for longer sessions.
- Highlights underperforming pages that may need better optimization or content improvements.
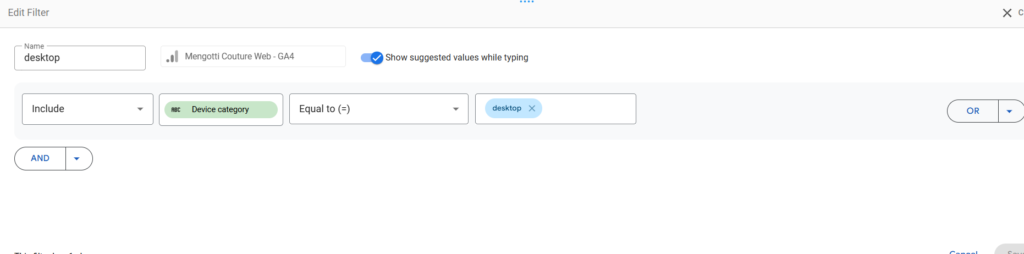
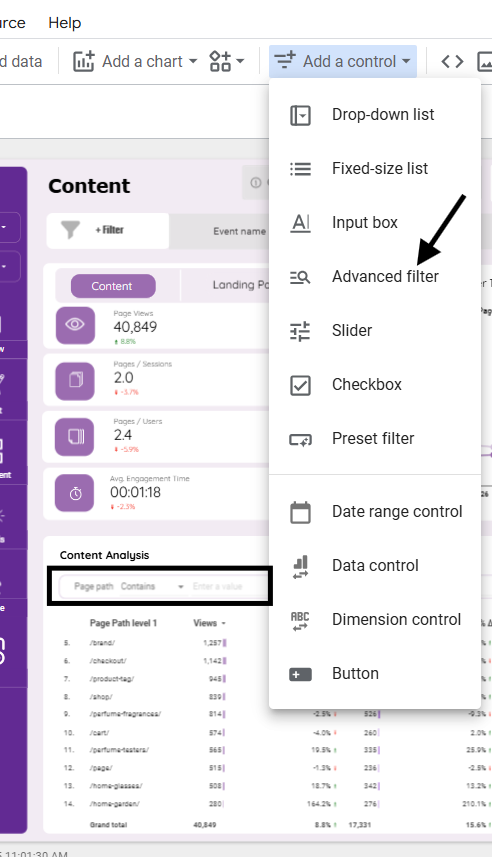
*Add advanced filters above the table.
*Style the table from its style section.
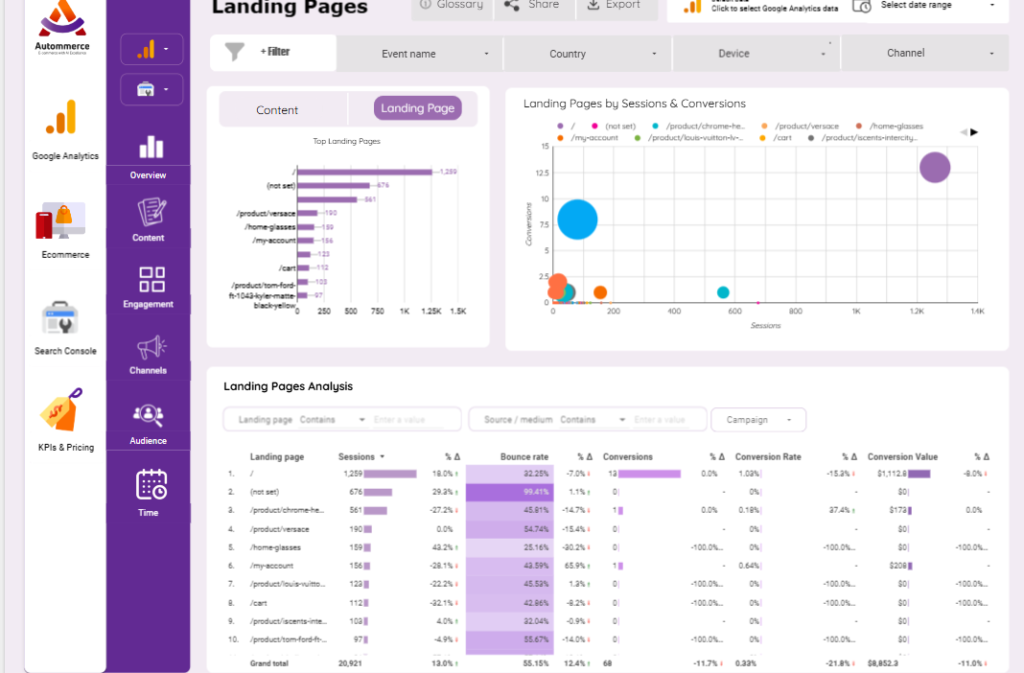
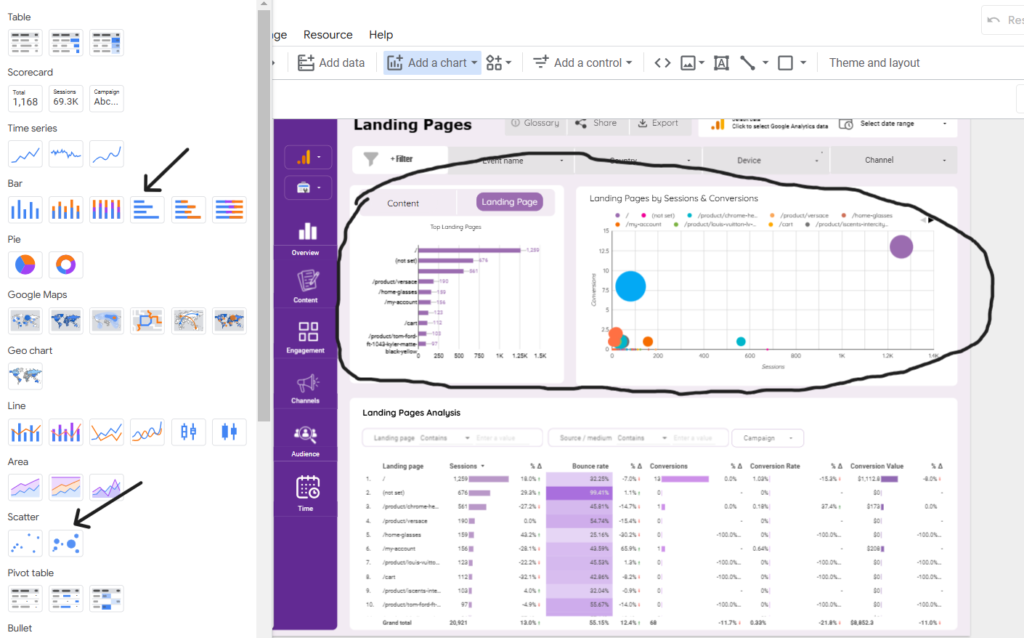
Landing Page tab:
The Landing Page tab evaluates the effectiveness of landing pages in driving traffic, engagement, and conversions.
- Top Landing Pages Performance (Bar Chart)
- Displays landing pages that attract the most traffic.
- Helps identify high-performing pages vs. underperforming pages.
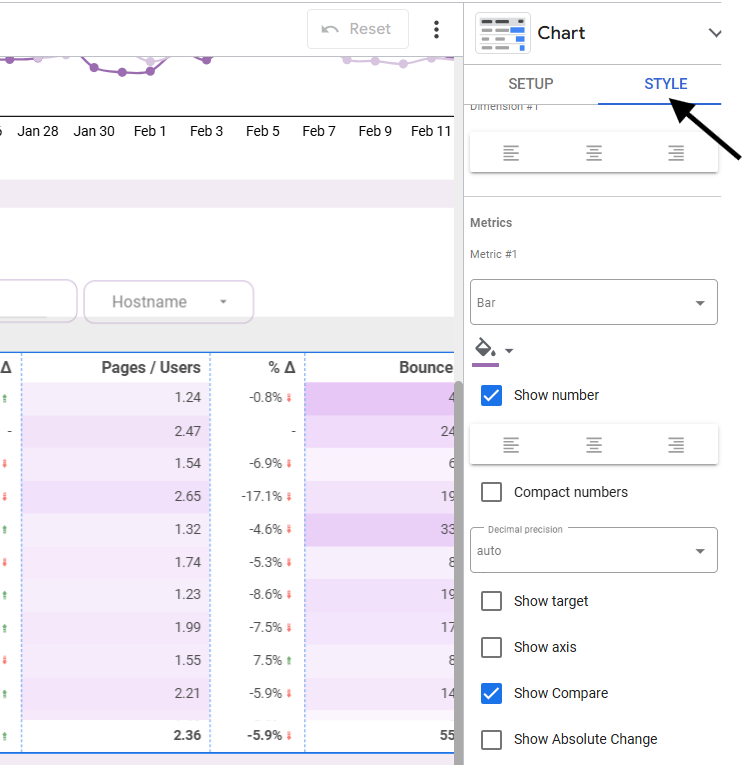
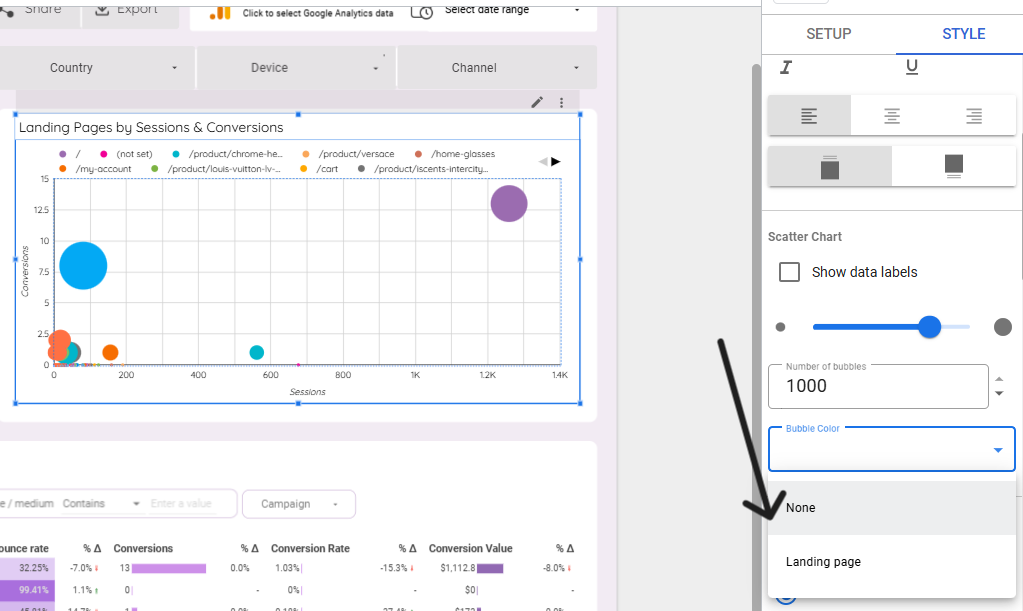
- Landing Pages by Sessions & Conversions (Bubble Chart)
- Plots landing pages based on session count and conversion rate.
- Larger bubbles indicate higher conversions.
- Landing Page Analysis Table
- Landing Page URLs: List of top-performing pages ranked by traffic and conversions.
- Sessions & Bounce Rate
- Conversion Rate & Revenue
*In bubble chart style, choose bubble color by landing page.
Engagement Section: Divided into three tabs
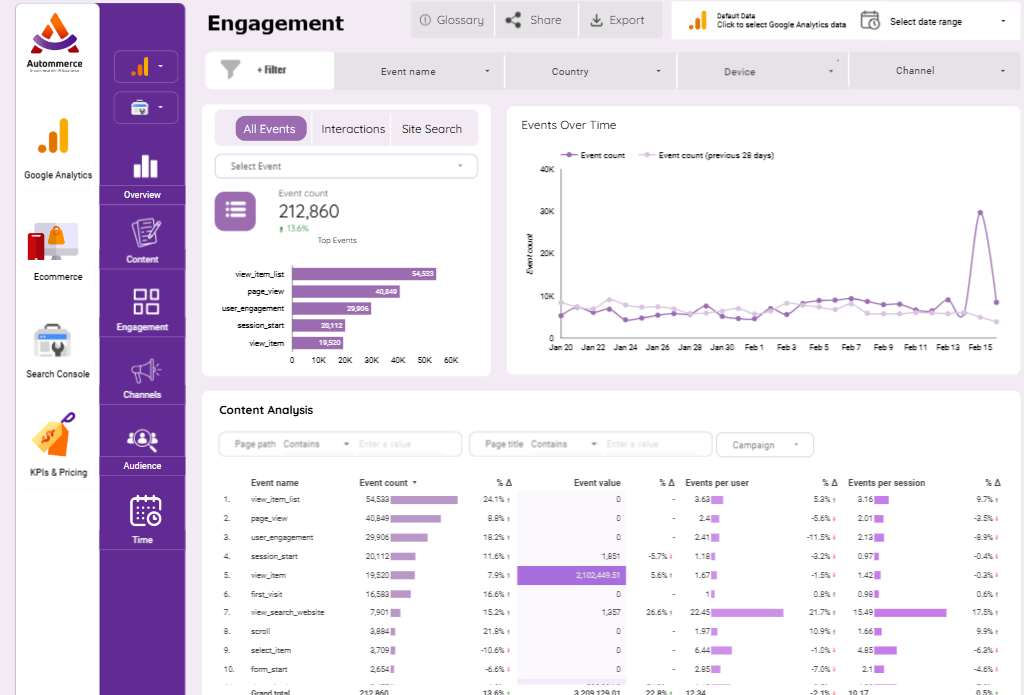
All Events Tab
The All Events tab provides insights into how users interact with the website, tracking events such as page views, clicks, and interactions. It helps businesses measure user engagement trends, event performance, and behavioral patterns, allowing them to optimize content and site functionality.
1. Engagement Performance Scorecards
- Total Event Count: Displays the total number of recorded user interactions (e.g., clicks, views, searches).
- Top Events: Lists the most frequently triggered events, such as:
- view_item_list – Users viewing product listings.
- page_view – Total page views.
- user_engagement – Indicates active interactions with site content.
- session_start – Tracks the start of a user session.
- view_item – Measures product page views.
2. Events Over Time (Line Chart)
- Displays the trend of event counts over a selected period, comparing with previous 28 days.
- Helps identify peak engagement days and trends (e.g., product launches, seasonal spikes).
3. Content Analysis Table
- Event Name: Lists key engagement events (page views, interactions, purchases).
- Event Count: Shows the total number of occurrences for each event.
- Event Value: Calculates the total impact of the event (e.g., revenue from purchases).
- Events Per User: Average number of times a user triggers an event.
- Events Per Session: How frequently events occur per session, helping gauge interaction depth.
4. User Behavior Insights
- Identifies the most common engagement actions taken by users.
- Highlights key engagement trends that drive higher conversion rates.
- Helps detect drop-off points where users disengage, indicating areas for site improvement.
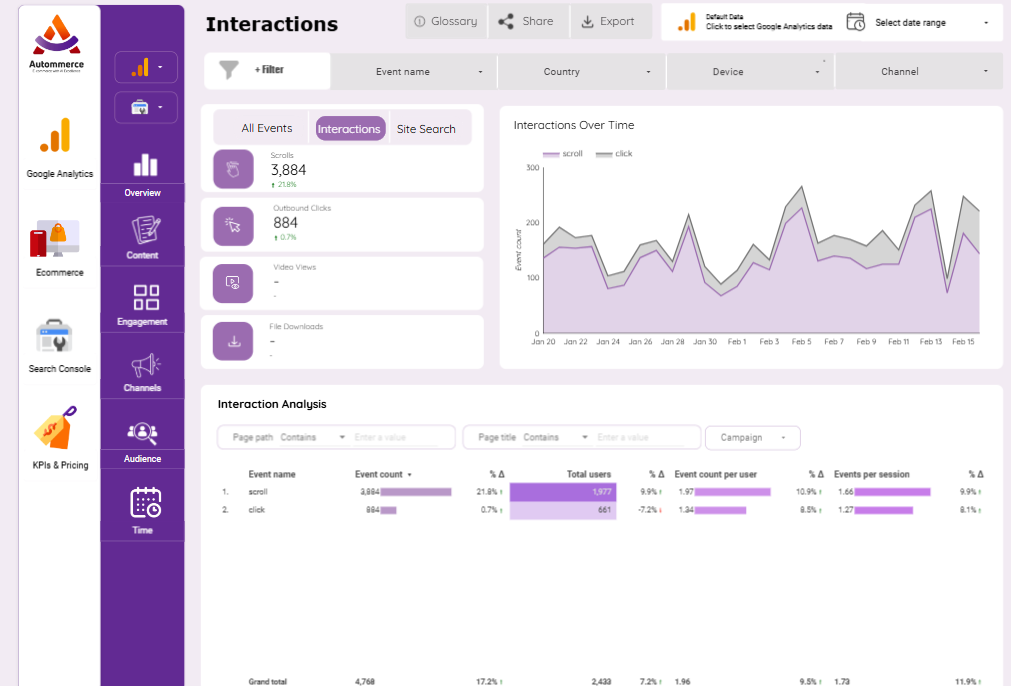
Interactions Tab
The Interactions tab tracks user engagement through specific actions, such as scrolling, clicking links, watching videos, and downloading files. This section helps businesses understand how users navigate and interact with the site, identifying opportunities to improve UX and content strategy.
1. Interaction Performance Scorecards
- Scrolls: The number of users who scrolled through a page, indicating engagement depth.
- Outbound Clicks: Tracks the number of clicks on external links leading away from the site.
- Video Views: Captures video interactions (currently no data in the example).
- File Downloads: Measures engagement with downloadable content (e.g., PDFs, catalogs).
2. Interactions Over Time (Line Chart)
- Displays scroll and click trends over time, helping identify peak engagement periods.
- Compares scroll and click events to highlight changes in user behavior.
3. Interaction Analysis Table
- Event Name
- Event Count
- Total Users
- Event Count Per User
- Events Per Session
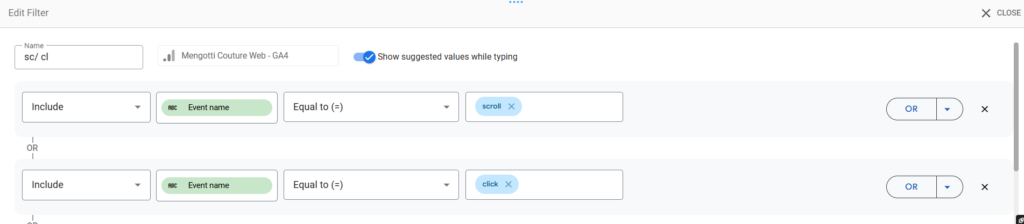
*Create filter to include event name equals scroll/ outbound clicks/ video views/ file downloads.
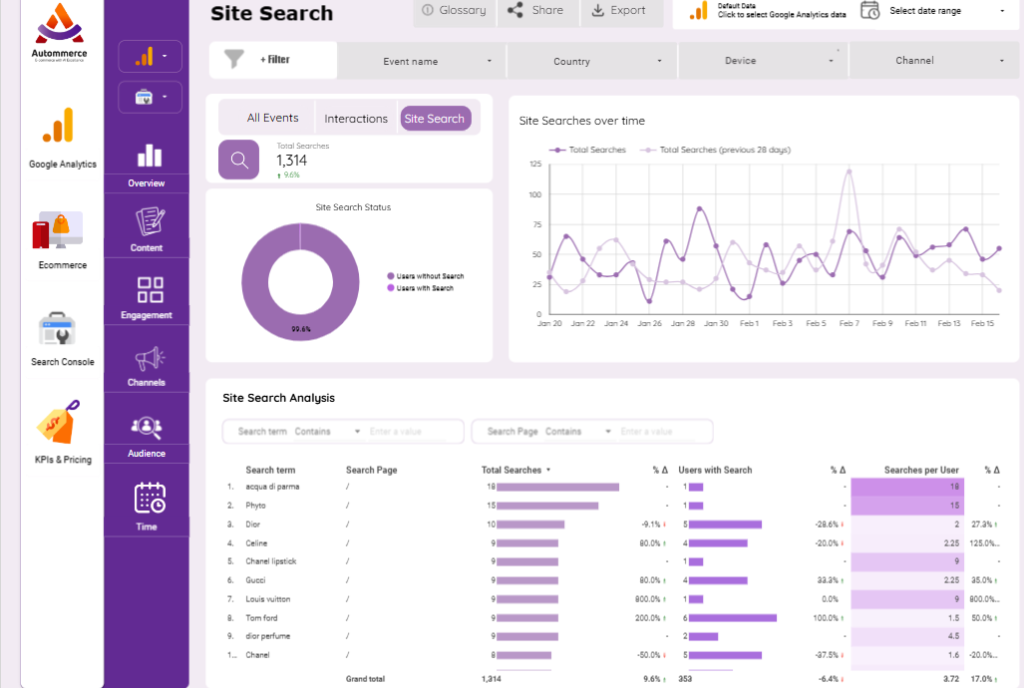
Site Search Tab
The Site Search Tab provides insights into how users interact with the website’s internal search function. It helps businesses understand what visitors are searching for, how often search is used, and whether the search experience meets user needs.
1. Site Search Performance Scorecards
- Total Searches: The total number of searches performed on the website.
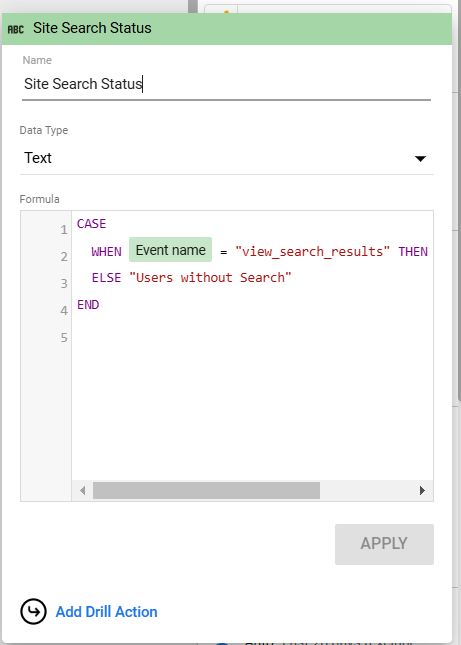
- Site Search Status (Pie Chart):
- Users Without Search: Percentage of visitors who navigated without using the search bar.
- Users With Search: Percentage of visitors who performed at least one search.
*Create Site Search Dimension to classify the type of users
2. Site Searches Over Time (Line Chart)
- Tracks search activity over a selected period.
- Compares current search volume vs. the previous 28 days to measure trends.
- Helps identify peak search periods and demand fluctuations.
3. Site Search Analysis Table
- Search Term: Lists the most frequently searched keywords or phrases.
- Search Page: Shows where users initiated searches (e.g., homepage, product pages).
- Total Searches: The number of times a specific term was searched.
- Users With Search: The number of unique users who performed searches.
- Searches Per User: The average number of searches conducted per user.
Channels Section: Divided into three tabs
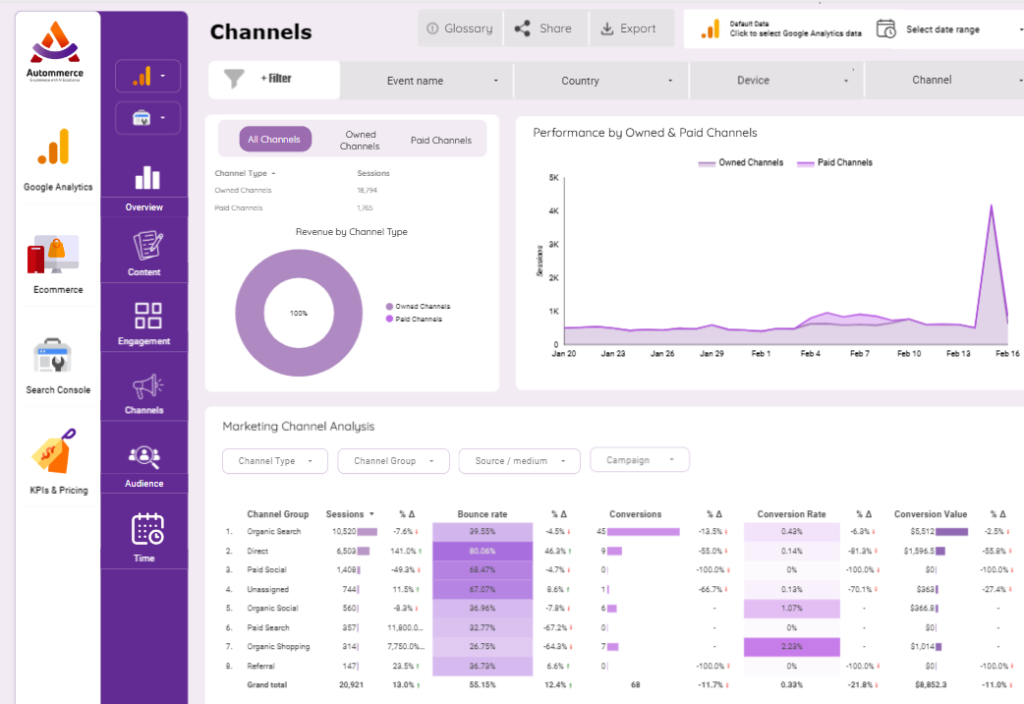
All Channels Tab
The All Channels Tab provides insights into how different marketing channels contribute to website traffic, conversions, and revenue. It helps businesses understand the performance of organic, paid, direct, referral, and social traffic sources, enabling data-driven marketing decisions.
1. Channel Performance Scorecards
- Owned Channels vs. Paid Channels:
- Owned Channels: Traffic coming from organic search, direct, referral, and social media.
- Paid Channels: Includes paid search, paid social, and other advertising sources.
- Sessions by Channel Type: Displays the total number of visits for owned and paid traffic.
- Revenue by Channel Type (Pie Chart): Visualizes revenue contribution from owned vs. paid traffic.
*Create Dimension Channel Type
* Channel Group is Session default channel group
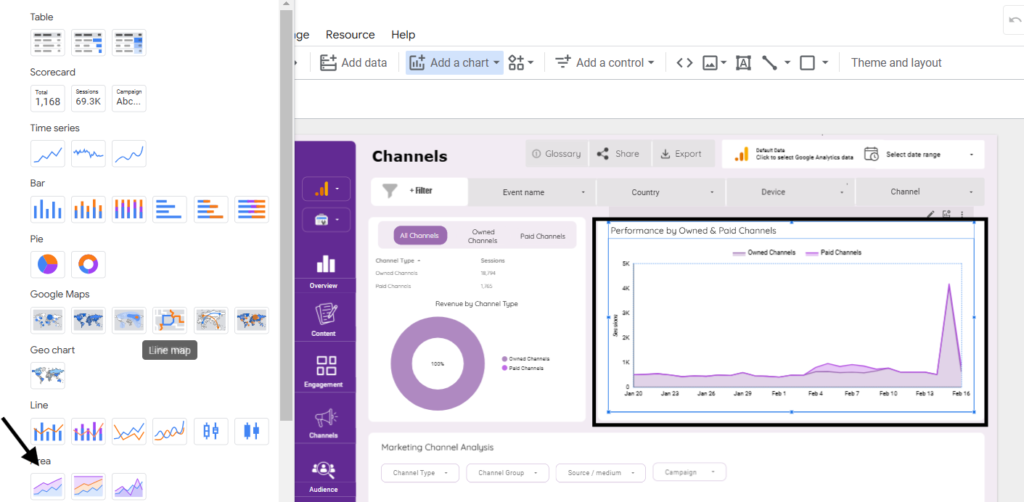
2. Performance by Owned & Paid Channels (Line Chart)
- Tracks traffic trends over time for different channel types.
- Highlights spikes in traffic due to marketing campaigns or organic growth.
3. Marketing Channel Analysis Table
- Channel Group: Lists key traffic sources (Organic Search, Direct, Paid Social, Referral, etc.).
- Sessions
- Bounce Rate
- Conversions
- Conversion Rate
- Conversion Value
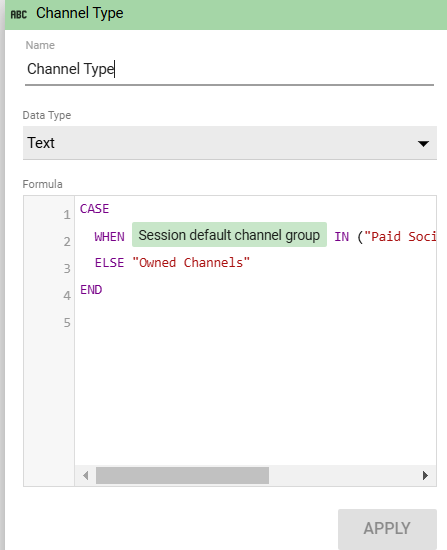
CASE
WHEN Session default channel group IN (“Paid Social”, “Paid Search”) THEN “Paid Channels”
ELSE “Owned Channels”
END
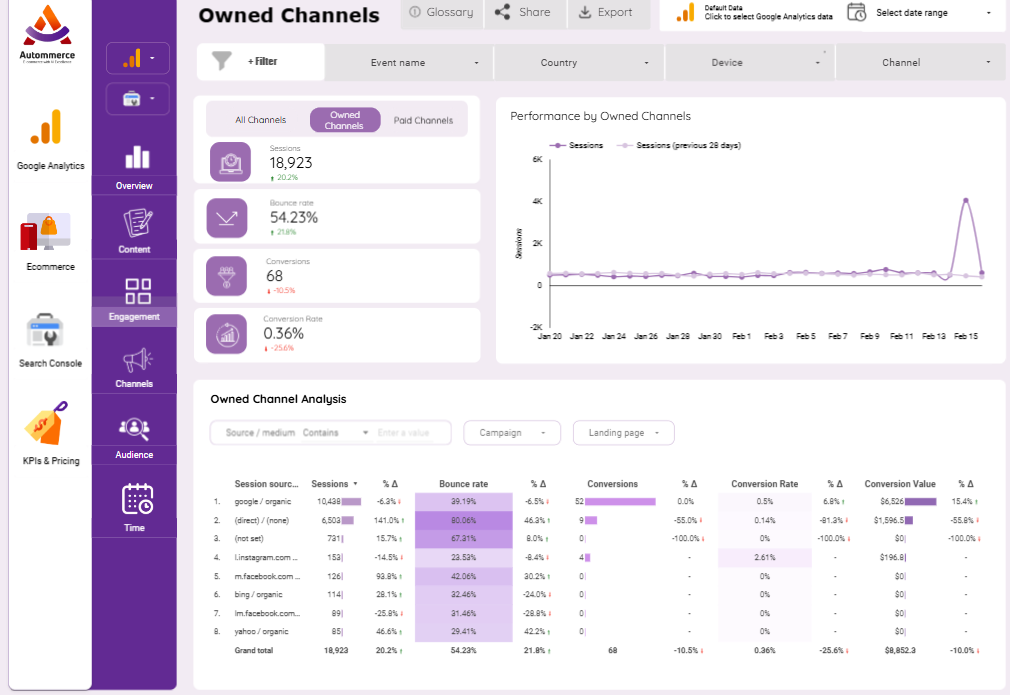
Owned & Paid Channels Tabs
The Owned & Paid Channels Tabs provide insights into traffic sources, differentiating between organic, direct (owned), and advertising-driven (paid) traffic. These pages help businesses evaluate marketing performance and optimize acquisition strategies.
1. Traffic Performance Scorecards
- Sessions
- Bounce Rate
- Conversions
- Conversion Rate
2. Performance Over Time (Line Chart)
- Tracks session trends for owned and paid traffic, comparing against the previous 28 days.
- Helps analyze fluctuations due to marketing campaigns or organic growth.
3. Traffic Source Analysis Table
- Session Source/Medium: Lists key sources of traffic:
- Owned: Google Organic, Direct, Social Media, Referral.
- Paid: Google Ads (CPC), Facebook/Instagram Paid, Paid Search.
- Sessions & Bounce Rate
- Conversions & Conversion Rate
- Conversion Value
*Make two filters 1 for owned channels and other for paid ones and filter charts of each section with them.
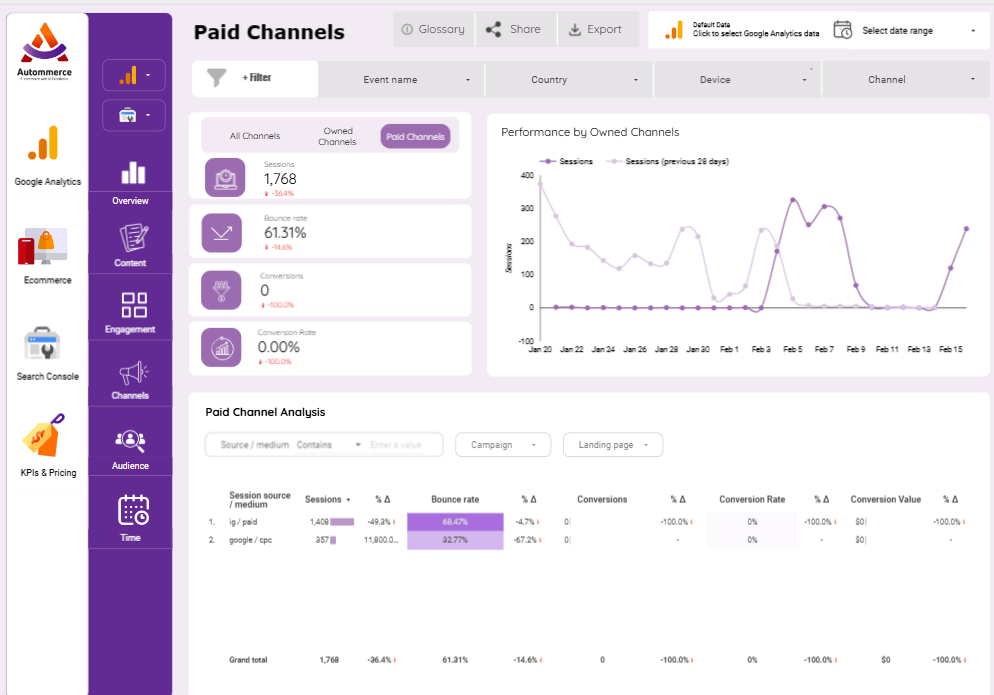
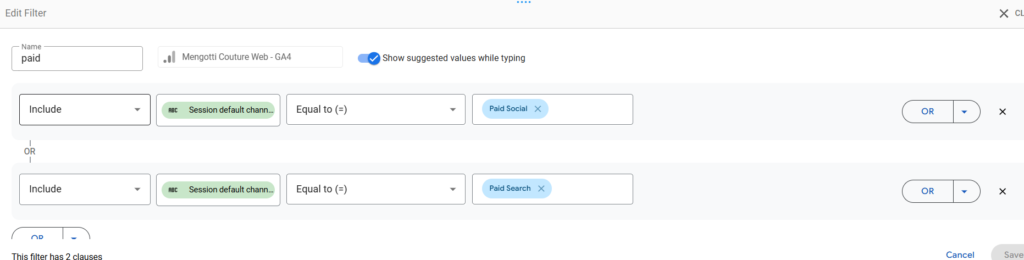
Paid Filter in our case of 2 classes
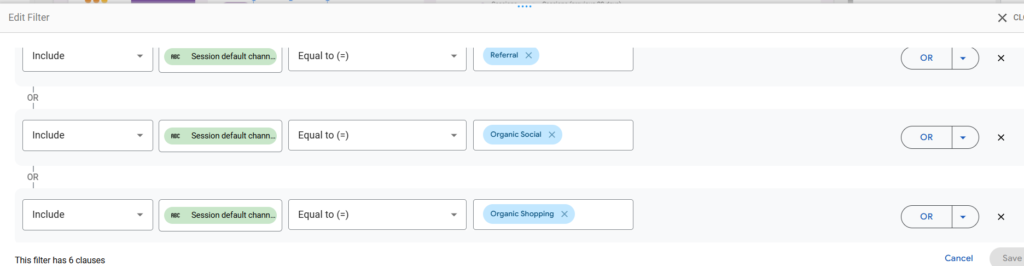
Organic Filter of 6 classes in our case (Referral/ Organic Social/ Organic Shopping/ Unassigned/ Direct)
Audience Section
The Audience Page provides insights into user characteristics, helping businesses understand who their visitors are, where they come from, and how they engage with the site. This section is divided into two key areas:
- Cultural/Geographical Data
- Demographic Data
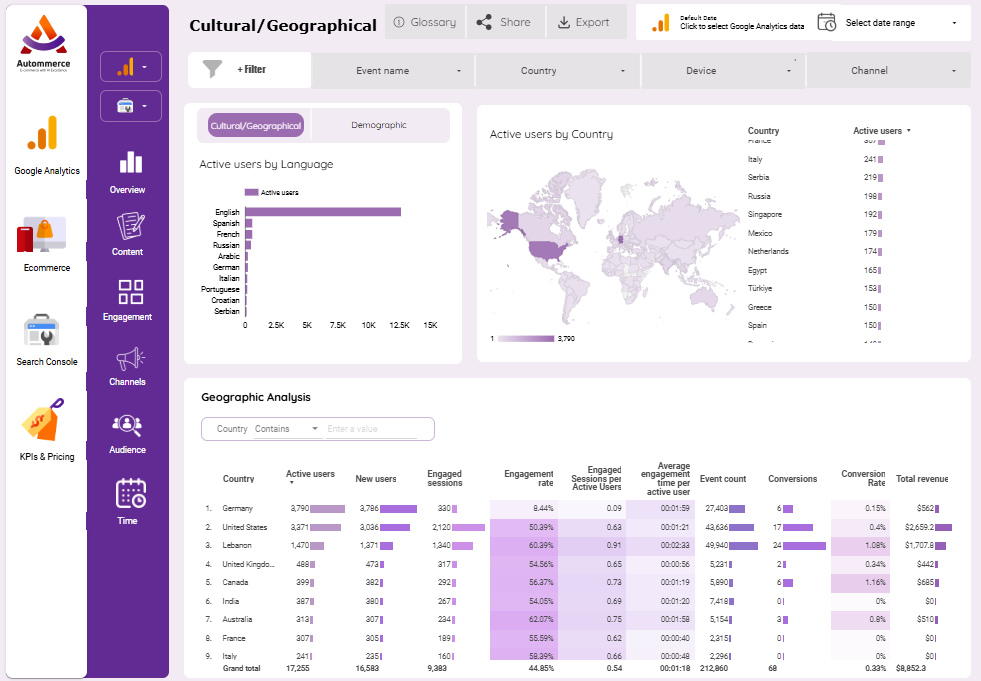
Cultural/Geographical Tab
The Cultural/Geographical tab focuses on the location and language of users, helping businesses tailor content, marketing strategies, and localization efforts.
1. Active Users by Language (Bar Chart)
- Displays the most commonly used languages among visitors.
- Helps businesses optimize multilingual content and translations for a better user experience.
2. Active Users by Country (Map & List)
- Geographic Heatmap: Shows where users are located globally.
- Country Ranking Table: Lists the top countries by active users.
- Identifies high-traffic regions, helping businesses prioritize localized marketing efforts.
3. Geographic Analysis Table
- Active Users & New Users: Tracks total users and first-time visitors per country.
- Engagement Metrics: Displays engagement rate, session count, and time spent per user.
- Conversion Metrics: Shows conversion rate and total revenue per country.
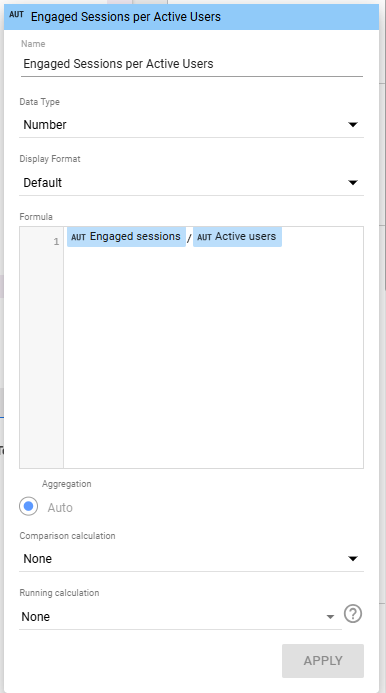
*Add new field Engaged Sessions per Active Users
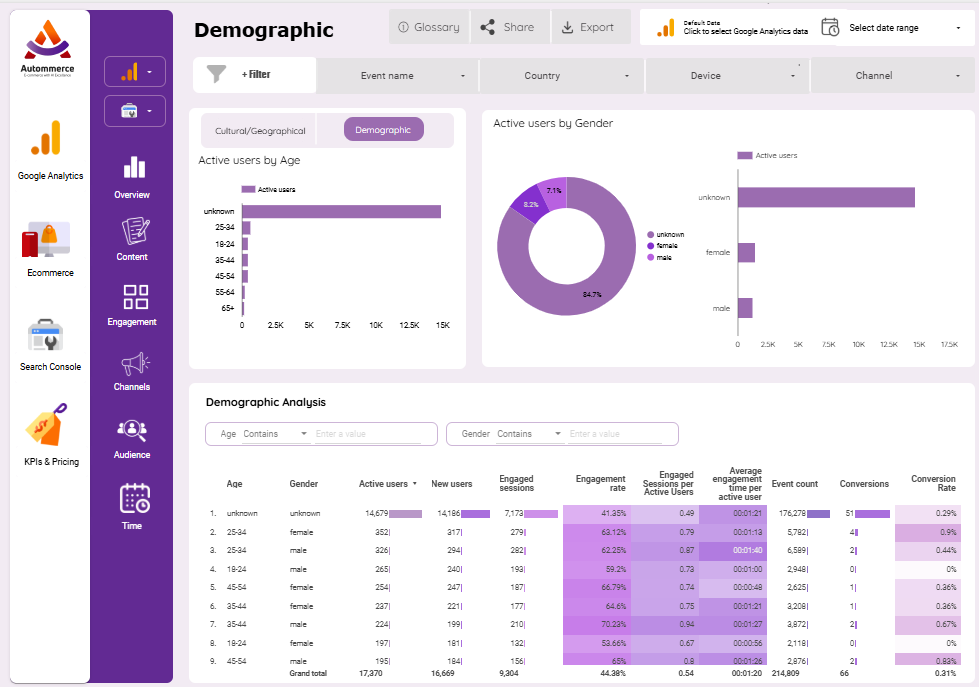
Demographic Tab
The Demographic tab provides insights into user attributes like age and gender, helping businesses refine targeting and improve user experience.
1. Active Users by Age (Bar Chart)
- Shows the distribution of visitors by age group.
- Helps businesses adjust product recommendations and marketing messaging to better fit their audience.
2. Active Users by Gender (Pie Chart & Bar Chart)
- Displays male, female, and unknown user distribution.
- Helps businesses understand how different genders engage with the site.
3. Demographic Analysis Table
- Breaks down users by age and gender.
- Includes new users, engagement rate, and conversion metrics per category.
- Helps businesses optimize targeting based on user demographics.
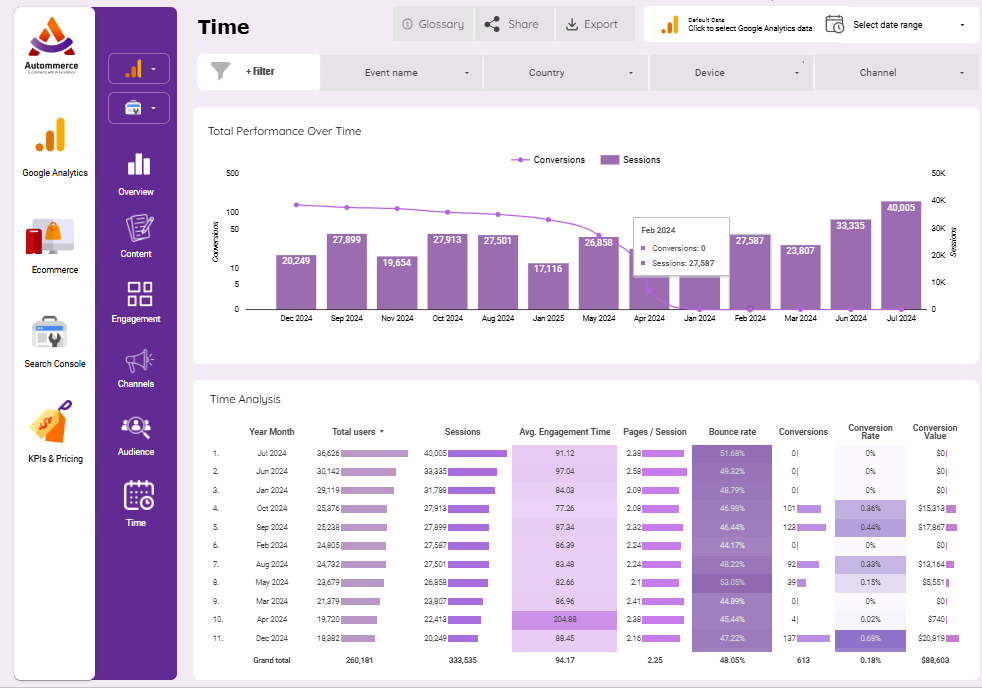
Time Section
The Time section provides insights into website performance over different time periods, helping businesses analyze trends in traffic, engagement, and conversions across months.
1. Total Performance Over Time (Line & Bar Chart)
- Sessions (Bar Chart)
- Conversions (Line Chart)
- Helps businesses identify seasonal trends and periods of high/low performance.
2. Time Analysis Table
- Total Users & Sessions
- Average Engagement Time
- Pages Per Session
- Bounce Rate
- Conversions & Conversion Rate
- Conversion Value
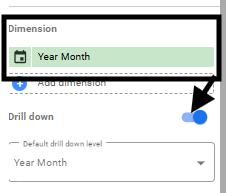
*Date is selected Year Month
Ecommerce Sections:
To streamline the Ecommerce analysis process and allow for deeper insights into key metrics, add six distinct buttons, each paired with an intuitive icon. These buttons should facilitate easy navigation and exploration of detailed analytics across different sections from GA4 data store.
*Drop down lists for Ecommerce Pages are “Source / medium which is mainly Session source / medium, Channel, Device, and Country”.
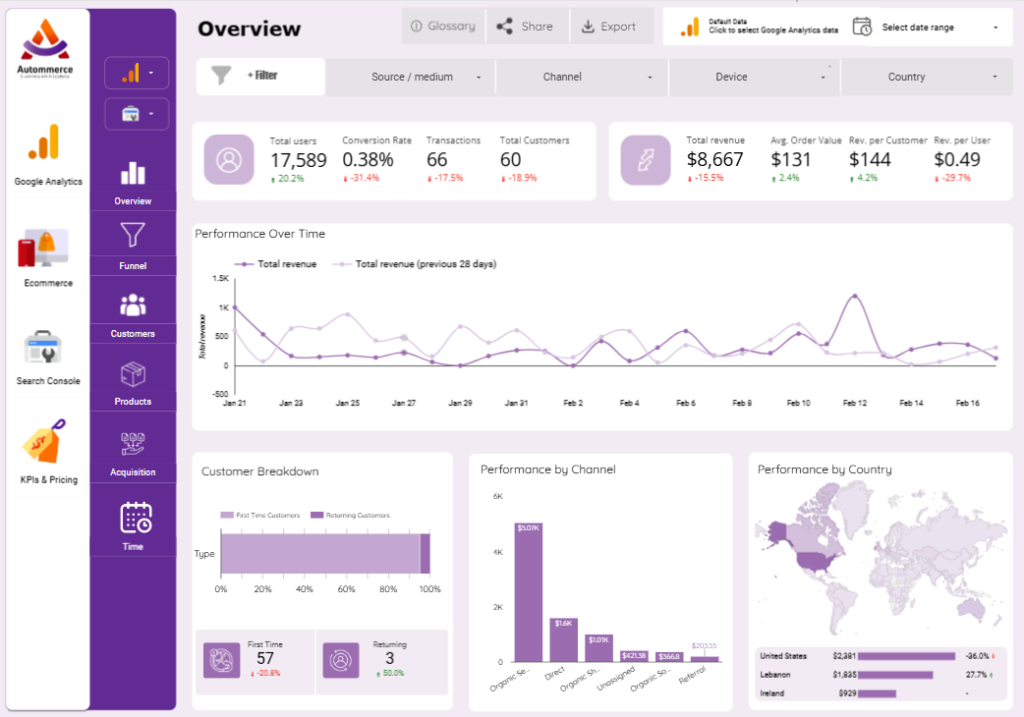
Overview Section
The Overview Section provides a high-level summary of the website’s performance, offering key insights into traffic, revenue, conversions, and customer trends. This section is essential for understanding overall eCommerce performance at a glance.
1. Performance Scorecards
- Total Users
- Conversion Rate
- Transactions: The total number of completed purchases.
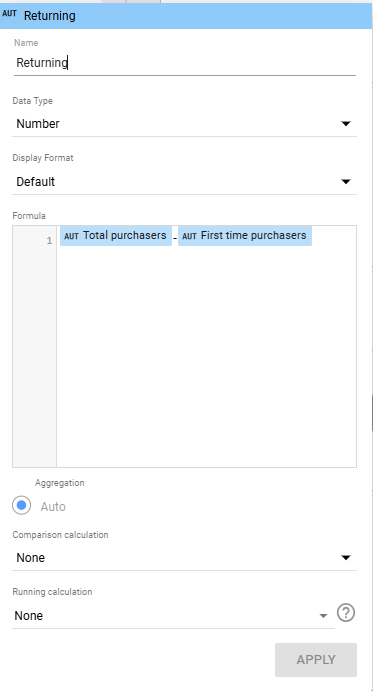
- Total Customers: Unique users who made a purchase.
- Total Revenue
- Average Order Value (AOV): The average amount spent per order.
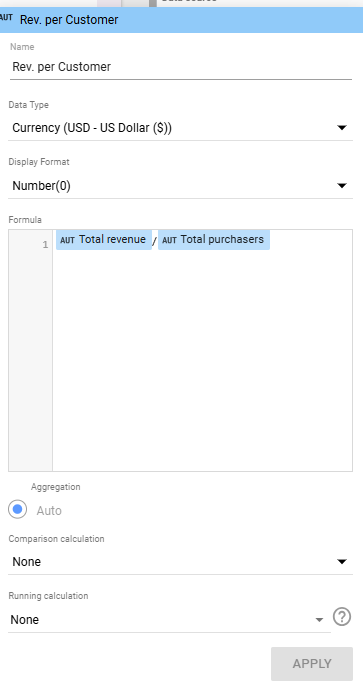
- Revenue per Customer: How much each customer generates on average (new field: Total Revenue / Total Purchasers).
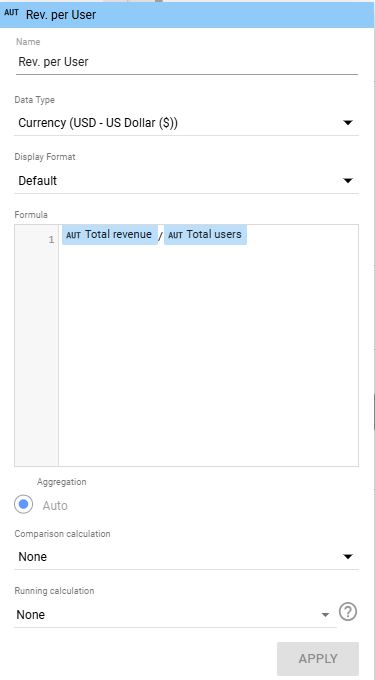
- Revenue per User: The average revenue per website visitor (new field: Total Revenue / Total Users)
2. Performance Over Time (Line Chart)
- Total Revenue Trends: Compares daily revenue with the previous 28-day period.
- Helps businesses identify sales spikes, dips, and seasonal fluctuations.
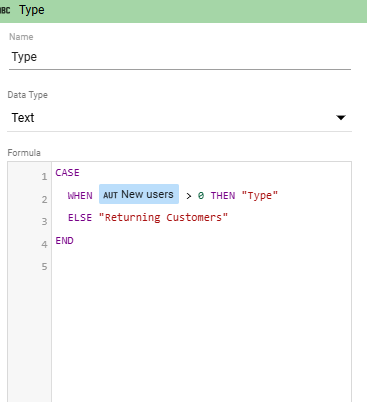
3. Customer Breakdown (Bar Chart)
- First-Time vs. Returning Customers:
- Displays the percentage and count of new vs. repeat buyers.
- Helps measure customer loyalty and retention trends.
*Create new field / dimension: Type, to classify Customers into First-Time and Returning.
*Create new field for returning scorecard (Total Users – First Time Purchasers)
4. Performance by Channel (Bar Chart)
- Highlights which marketing channels drive the most revenue.
- Includes Organic Search, Direct, Paid, Referral, and Social sources.
- Helps businesses optimize channel investment based on revenue contribution.
5. Performance by Country (Map & Table)
- Geographic Revenue Trends:
- Displays revenue by country.
- Identifies top-performing markets and regions needing improvement.
- Growth & Decline Indicators:
- Compares revenue change by region over time.
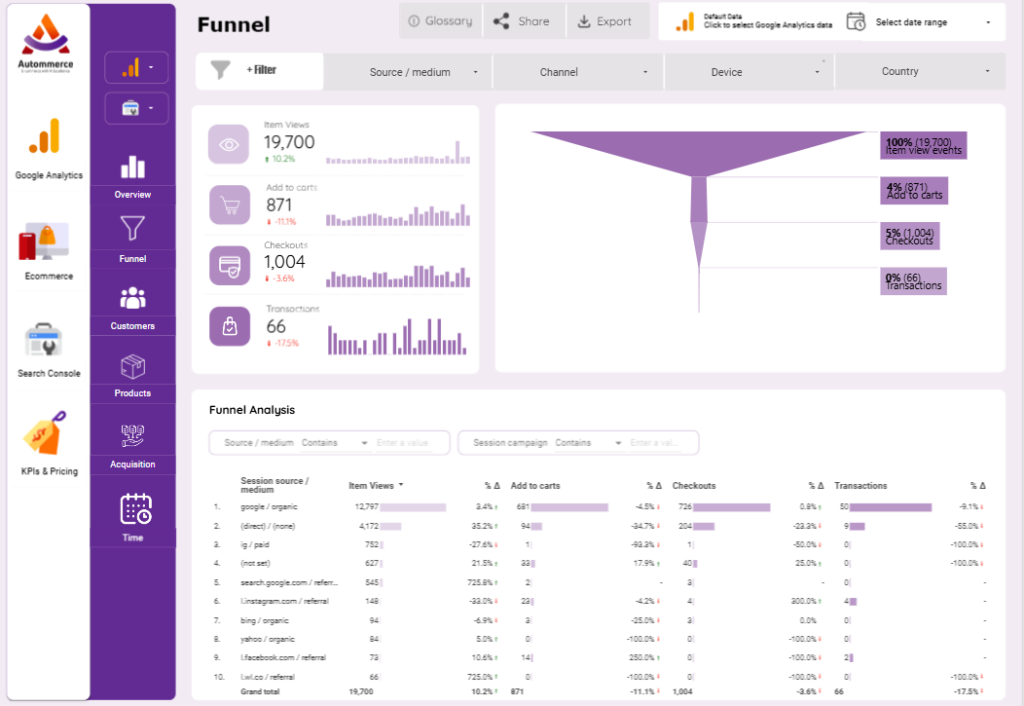
Funnel Section
The Funnel Page analyzes user progression through the conversion funnel, from viewing products to making a purchase.
- Item Views: The total number of product page views.
- Add to Carts: The number of times products were added to the cart.
- Checkouts: The number of initiated checkouts.
- Transactions: The total number of successful purchases.
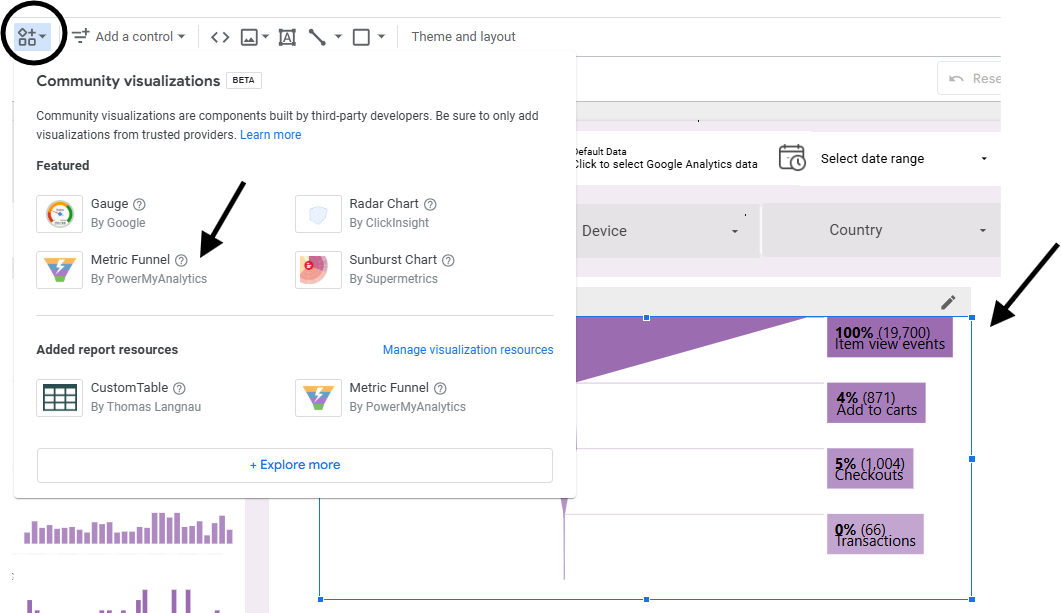
Visualizations:
- Funnel Chart: Illustrates drop-off rates at each step.
- Funnel Analysis Table: Breaks down conversion rates based on session source and medium.
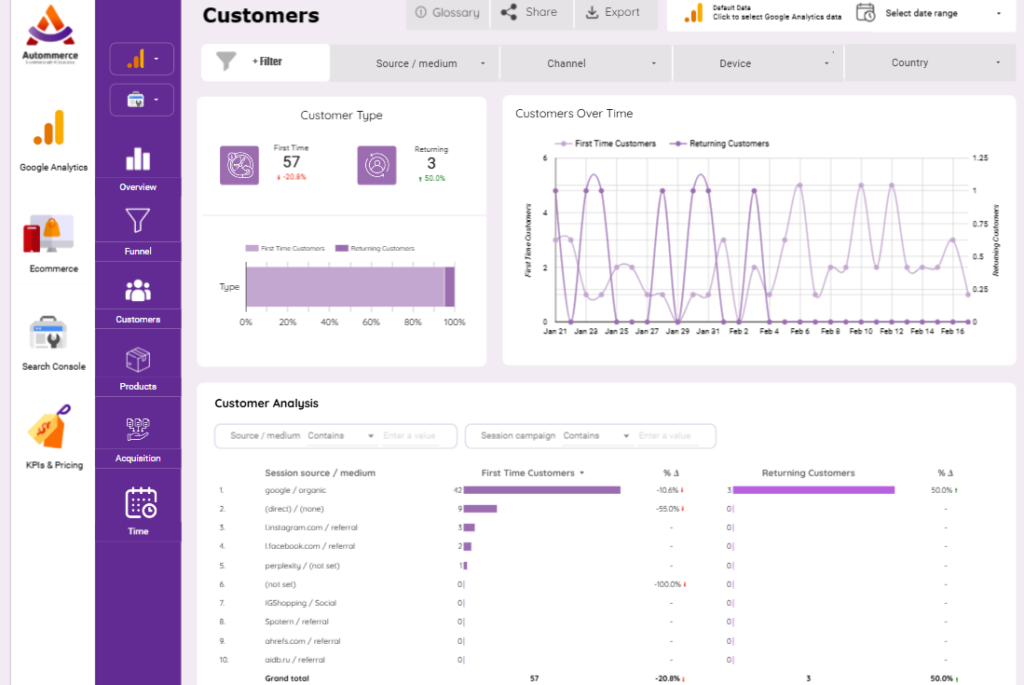
Customers Section
This page provides insights into customer behavior, including first-time and returning customers.
- First-Time Customers: The number of users making their first purchase.
- Returning Customers: Customers who made repeat purchases.
Visualizations:
- Customers Over Time: A time-series graph tracking customer trends.
- Customer Type Breakdown: A bar chart comparing new and returning customers.
- Customer Analysis Table: Analyzes session sources and customer retention.
Products Section: Divided into three tabs
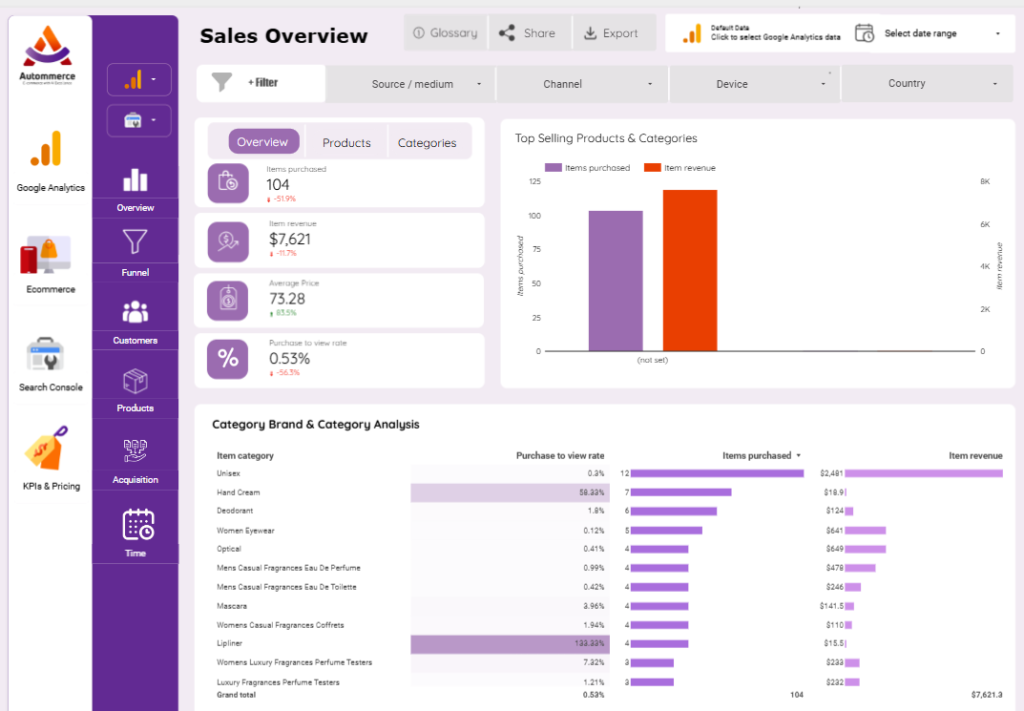
Sales Overview Tab
The Sales Overview tab provides insights into revenue, item purchases, and category performance.
Key Metrics:
- Items Purchased: The number of products bought.
- Item Revenue: Total revenue from product sales.
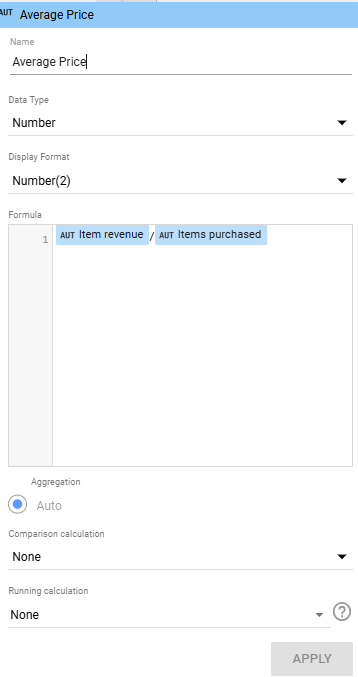
- Average Price: The average selling price of products (create new field: item revenue / item purchased).
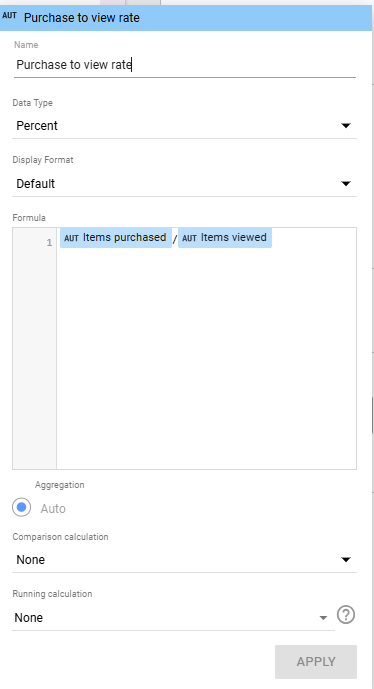
- Purchase to View Rate: The percentage of product views that converted into purchases (create new field: item purchased / item viewed).
Visualizations:
- Top Selling Products & Categories: Bar charts displaying sales performance.
- Category & Brand Analysis: A detailed breakdown of revenue by product category.
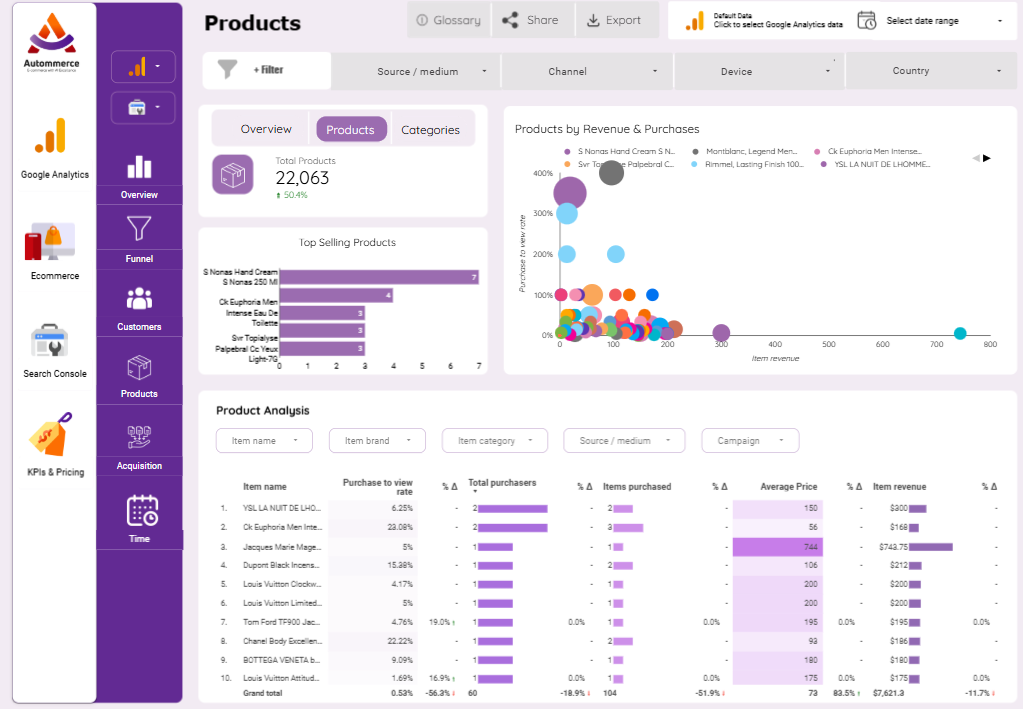
Products Tab
The Products tab provides a comprehensive view of product performance, analyzing how different items contribute to revenue and customer purchases. It highlights key insights into best-selling products, conversion rates, and overall sales trends.
Key Metrics & Insights:
- Total Products: Displays the total number of available products, reflecting inventory size.
- Purchase to View Rate
- Total Purchases
Visual Breakdown:
- Top Selling Products: A bar chart ranking the best-performing products based on the number of purchases, allowing businesses to see which items drive the most sales.
- Products by Revenue & Purchases: A scatter plot illustrating the relationship between revenue and purchases for different products. Larger and higher-positioned bubbles indicate high-value products that contribute the most to revenue.
Product Analysis Table:
This section provides detailed insights into individual product performance, showing data on purchase-to-view rates, total purchases, average price, and revenue contribution. It helps businesses understand which products attract the most engagement and generate the highest returns.
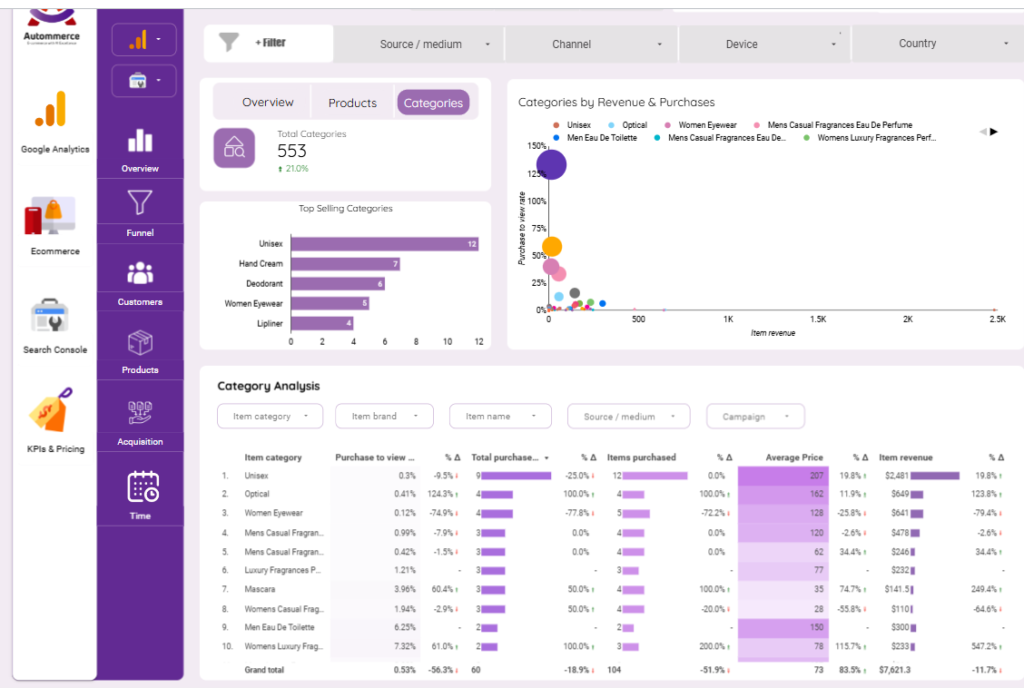
Categories Tab
The Categories tab provides insights into product category performance, highlighting which groups of products contribute the most to sales and revenue. It helps businesses understand purchasing trends at the category level, allowing for better product management and marketing strategies.
Key Metrics & Insights:
- Total Categories: Displays the total number of product categories available, reflecting the diversity of offerings.
- Purchase to View Rate: Measures how likely customers are to buy after viewing a product within a category.
- Total Purchases: Shows the total number of products purchased per category, helping identify high-performing segments.
Visual Breakdown:
- Top Selling Categories: A bar chart ranking the best-performing product categories based on sales volume. This helps businesses focus on high-demand categories.
- Categories by Revenue & Purchases: A scatter plot that visually represents the relationship between purchases and revenue for each category. Larger and higher-positioned bubbles indicate categories generating the most revenue.
Category Analysis Table:
This section provides a detailed breakdown of category performance, including purchase-to-view rates, total purchases, average prices, and revenue contributions. It helps businesses track which product categories drive the highest sales and revenue.
Acquisition Section: Divided into three tabs
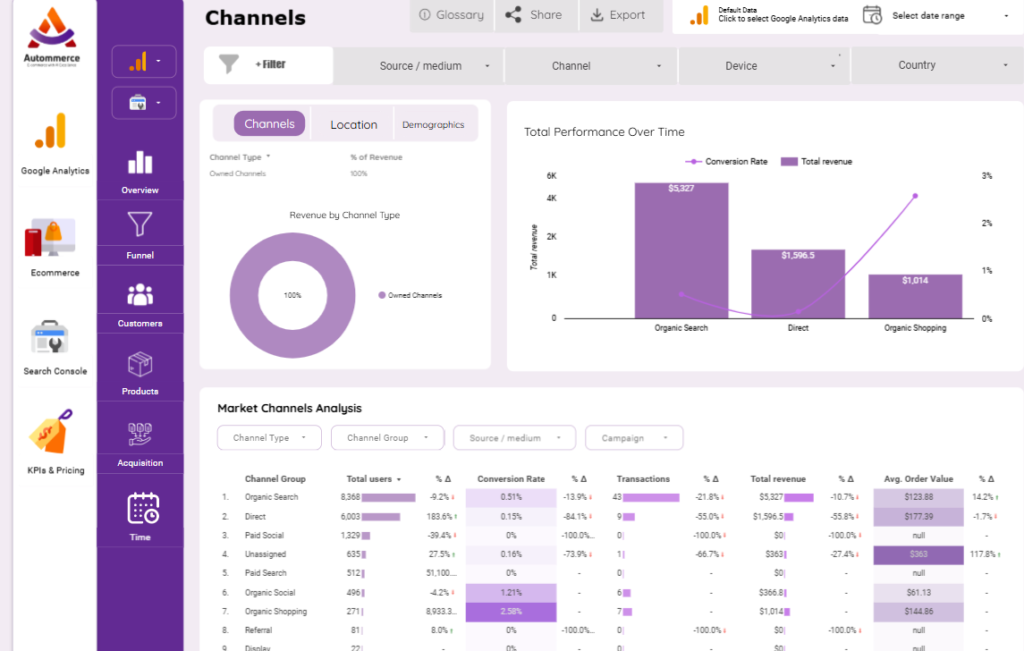
Channels Tab
The Channels Section analyzes the performance of different marketing channels, helping businesses understand where their traffic and revenue come from. It provides a detailed breakdown of how each channel contributes to sales, conversions, and overall business growth.
Key Metrics & Insights:
- Revenue by Channel Type: Shows the distribution of revenue across different traffic sources, distinguishing between Owned and Paid channels.
- Conversion Rate by Channel: Measures the percentage of users converting into customers within each channel, indicating the effectiveness of different marketing efforts.
- Market Channel Analysis: Presents a breakdown of total users, revenue, order values, and conversions for each channel, helping businesses optimize marketing investments.
Visual Breakdown:
- Performance Over Time: A trend chart comparing revenue generated over time across different channels. This helps businesses track fluctuations and identify high-performing periods.
- Revenue Breakdown by Channel: A pie chart representing the proportion of revenue contributed by different channels, offering a quick overview of traffic sources.
Market Channels Analysis Table:
This tab provides a detailed breakdown of key performance indicators (KPIs) for each marketing channel, including user acquisition, conversion rates, transactions, and total revenue. It helps businesses determine which channels are driving the best results and which need optimization.
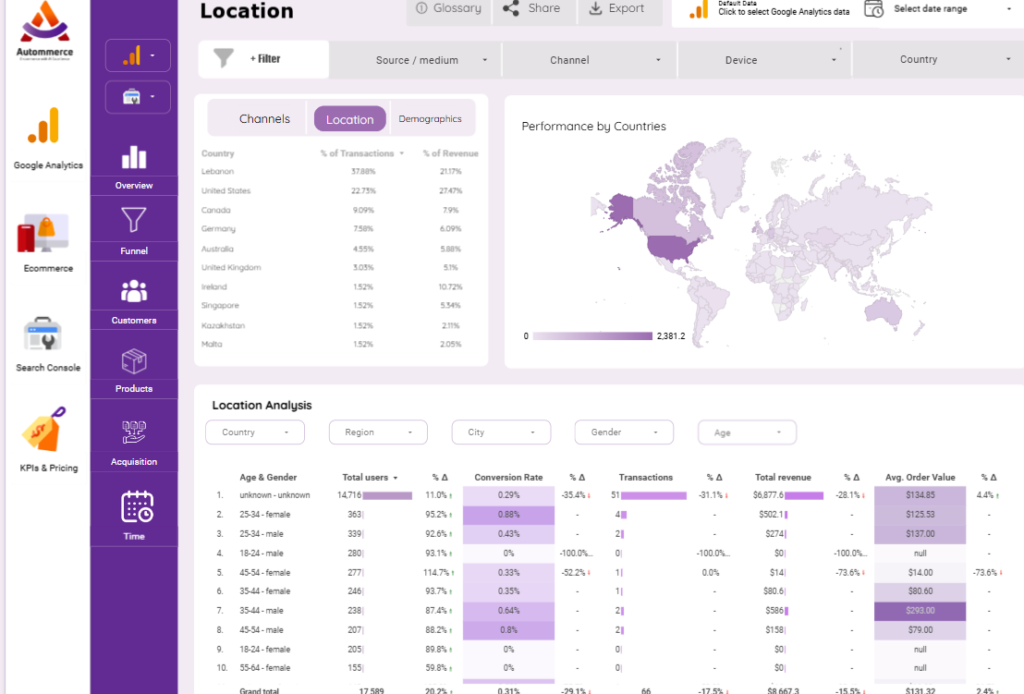
Location Tab
The Location tab provides insights into how different geographic regions contribute to user engagement and sales.
Key Metrics:
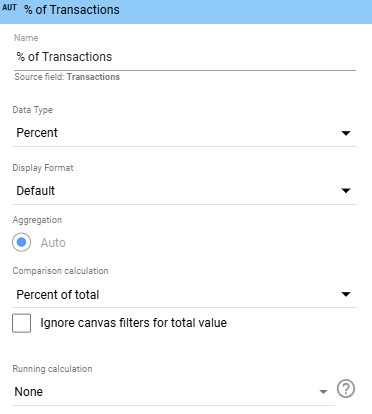
- % of Transactions by Country – The percentage of total transactions coming from different countries.
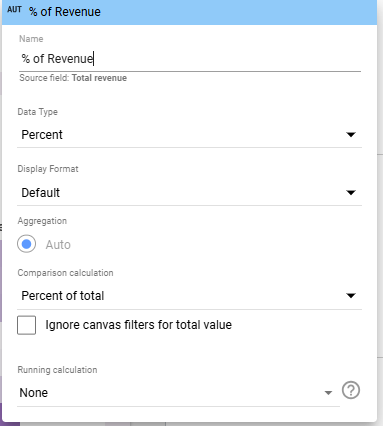
- % of Revenue Contribution – The share of total revenue generated by each country.
- Conversion Rate by Location – Measures how well different regions convert users into buyers.
*Make data type as Percent and comparison calculation as percent of total for % of Transactions and Revenue.
Visualizations:
- Performance by Countries (Heatmap) – A world map highlighting key geographic markets based on user activity and revenue generation.
- Location Analysis Table – A detailed breakdown of user demographics, transactions, and revenue by country, city, and region.
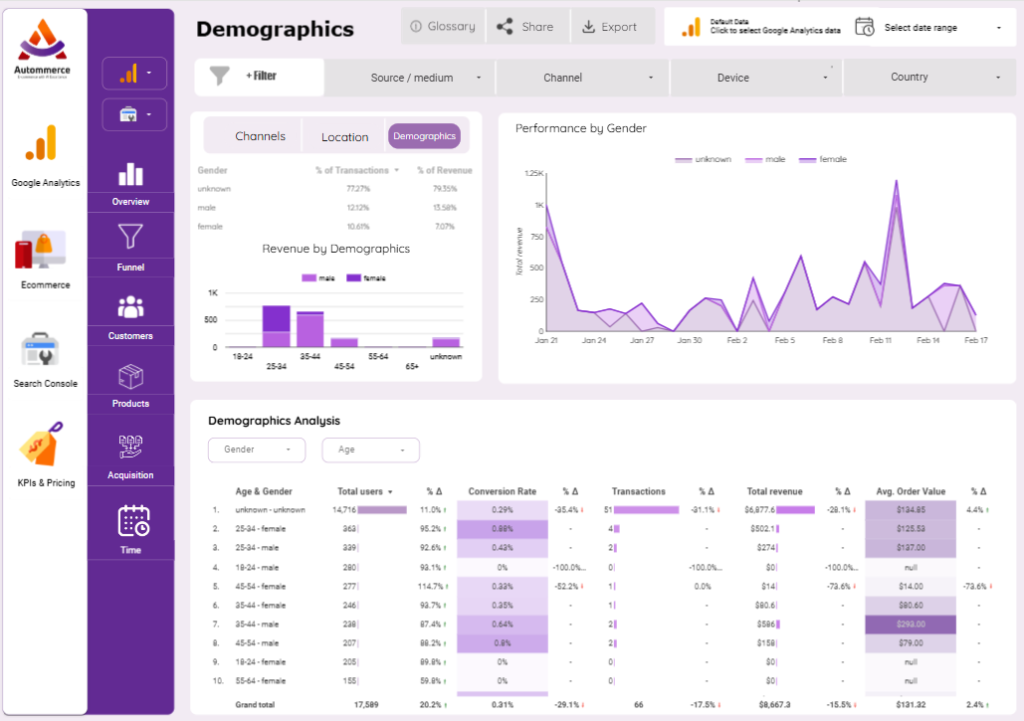
Demographics Tab
The Demographics tab provides insights into user characteristics, focusing on age and gender distribution and their impact on revenue and transactions.
Key Metrics:
- Transactions by Gender – Breaks down the percentage of total transactions across different gender groups.
- Revenue by Age & Gender – Displays the contribution of different age and gender segments to total revenue.
- Conversion Rate by Demographics – Measures the likelihood of conversions based on user demographics.
Visualizations:
- Revenue by Demographics – A bar chart showing revenue distribution across age and gender segments.
- Performance by Gender – A stacked column chart tracking revenue trends for male, female, and unknown gender groups over time.
- Demographics Analysis Table – A detailed breakdown of user activity, transactions, and revenue contribution segmented by age and gender.
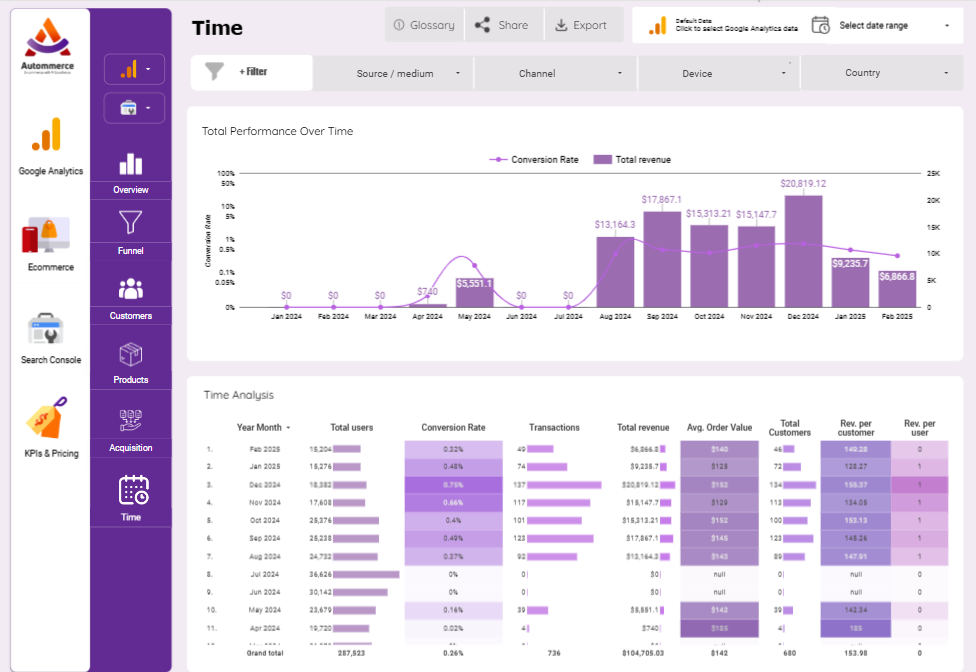
Time Section
The Time Section analyzes performance trends over time, helping to identify seasonal patterns and long-term growth.
Key Metrics:
- Total Users Over Time – The number of unique visitors per month.
- Conversion Rate Trends – How conversion rates fluctuate across different time periods.
- Revenue Trends – The total revenue generated month by month.
- Transactions Per Month – The number of successful purchases made over time.
Visualizations:
- Total Performance Over Time – A combined bar and line chart comparing total revenue and conversion rate trends.
- Time Analysis Table – A detailed breakdown of total users, transactions, conversion rate, revenue, average order value, and revenue per user for each month.
Search Console Sections:
To streamline the Search Console analysis process and allow for deeper insights into key metrics, add six distinct buttons, each paired with an intuitive icon. These buttons should facilitate easy navigation and exploration of detailed analytics across different sections from Google Search Console data store.
*Drop down lists for Ecommerce Pages are “Search Type, Country, Device Category, and Query”.
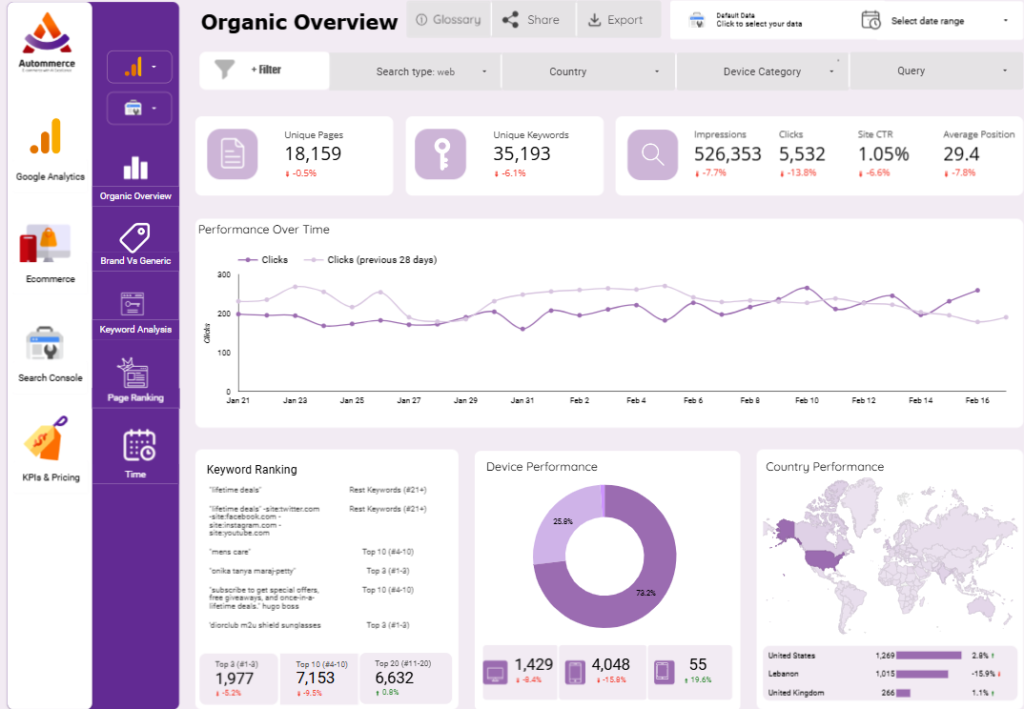
Organic Overview Section
The Organic Overview Section provides a comprehensive view of organic search performance, focusing on visibility, engagement, and user behavior across devices and locations.
Key Metrics (Top Scorecards)
- Unique Pages: Tracks the number of indexed pages, indicating site coverage in search engines (create new field: COUNT_DISTINCT (Landing Page).
- Unique Keywords: Shows the variety of keywords driving organic traffic, reflecting search visibility (create new field: COUNT_DISTINCT (Query).
- Impressions: Measures how often pages appear in search results.
- Clicks: Counts user interactions with search results, indicating engagement.
- Site CTR (Click-Through Rate): The percentage of impressions that convert to clicks, reflecting content relevance.
- Average Position: Average ranking of pages in search results, impacting visibility and traffic potential.
Performance Over Time (Line Chart)
- Compares clicks over time with the previous period.
- Highlights traffic trends and seasonal patterns, helping identify content performance issues.
Keyword Ranking (Table)
- Categorizes keywords into Top 3, Top 10, Top 20, and beyond.
- Shows the distribution of keyword positions, highlighting ranking gains or drops.
* Create new field Ranking Group
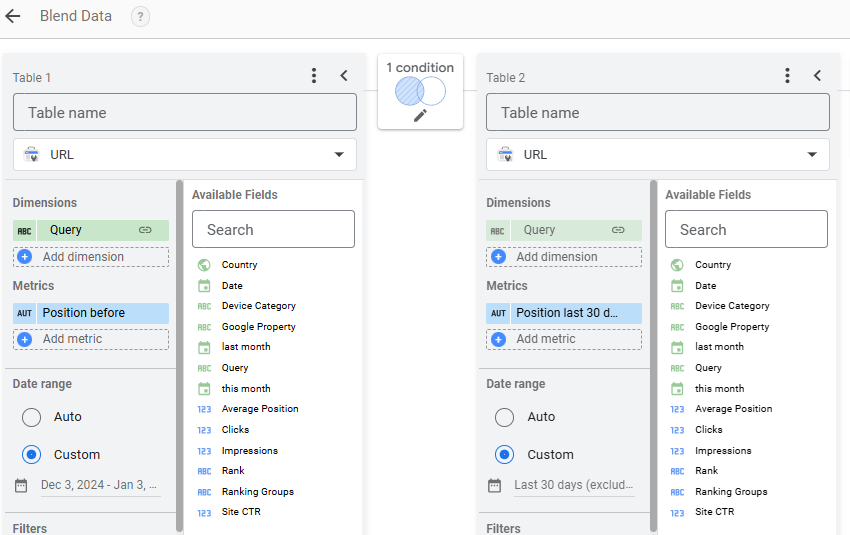
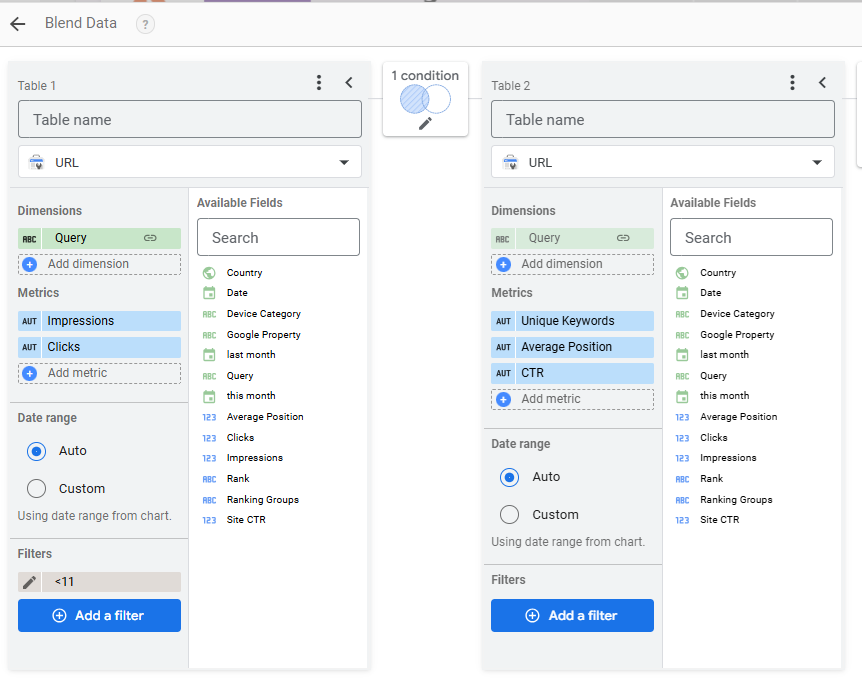
*Blend Data to get Top 3,10, and 20 in scorecards and make filters in Keyword Ranking part.
Device Performance (Donut Chart & Table)
- Visualizes traffic distribution by Mobile, Desktop, and Tablet.
- Helps assess device-specific user behavior and optimize for mobile or desktop experiences.
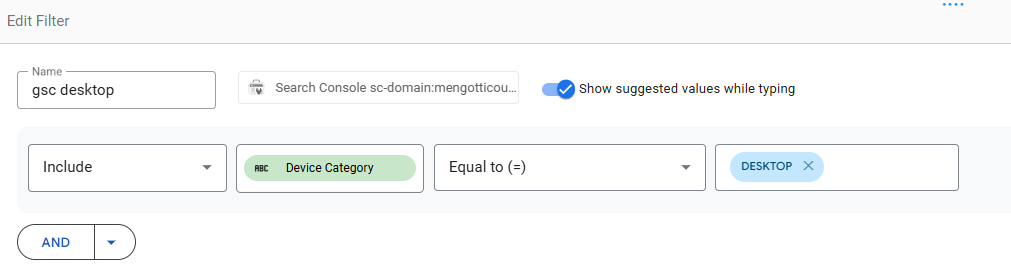
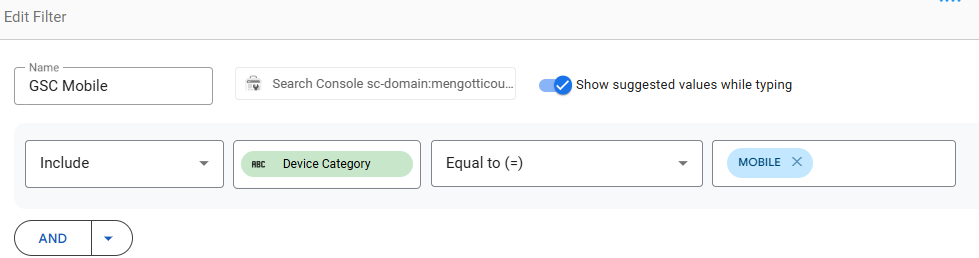
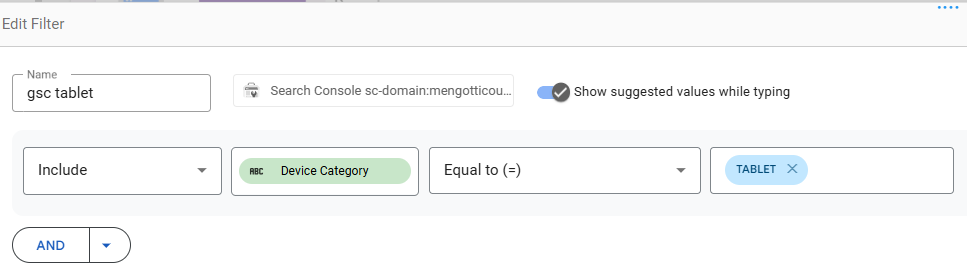
*Create Filters to get clicks from desktop, mobile, and tablet in scorecards of Device Performance part.
Country Performance (Map & Table)
- Displays click distribution by country.
- Identifies regional performance trends and opportunities for localization
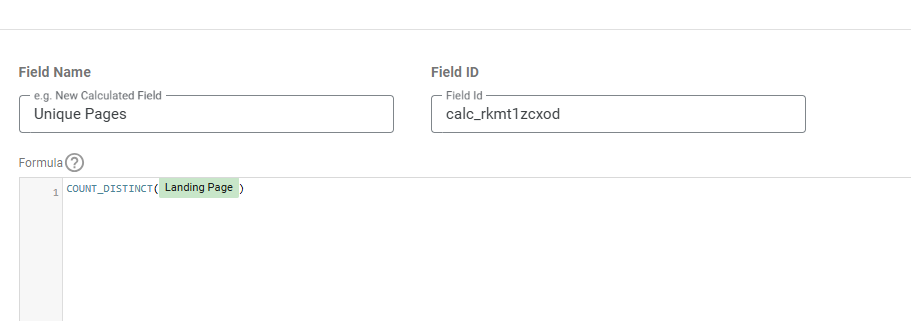
Create new field Unique Pages
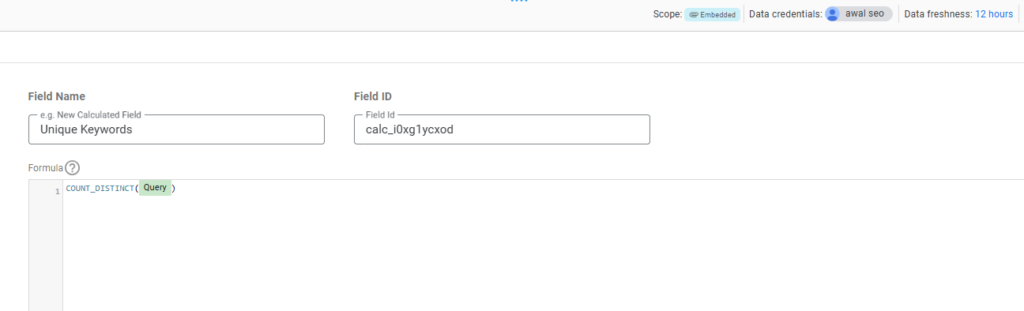
Create new field Unique Keywords
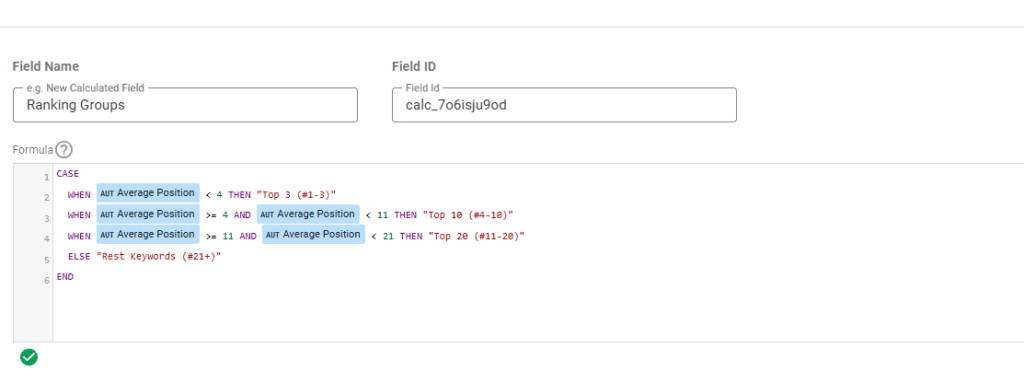
Create new field Ranking Groups
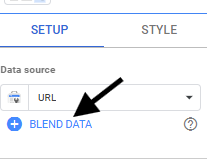
Make blend data.
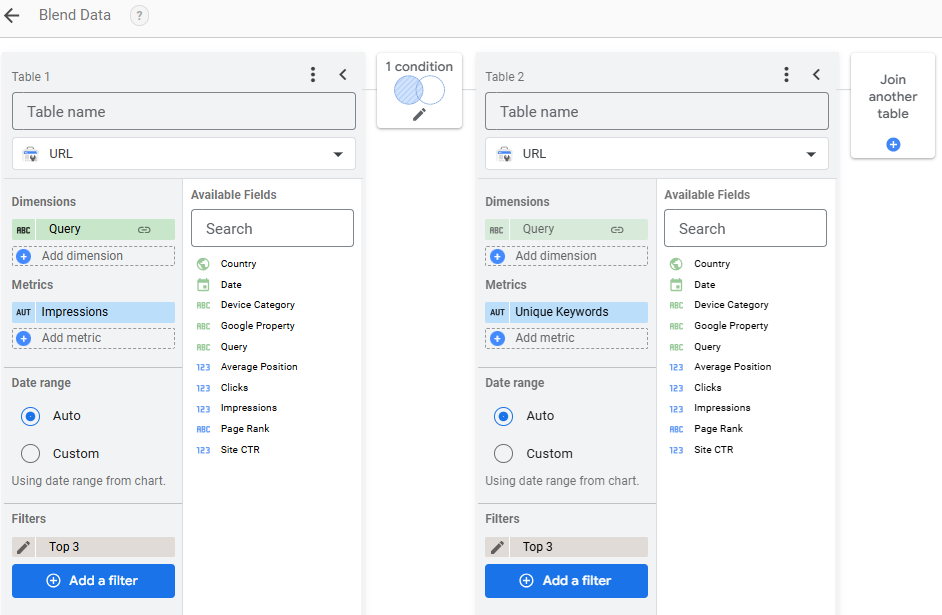
Make 3 blended data with same dimensions and metrics but each with different filter.
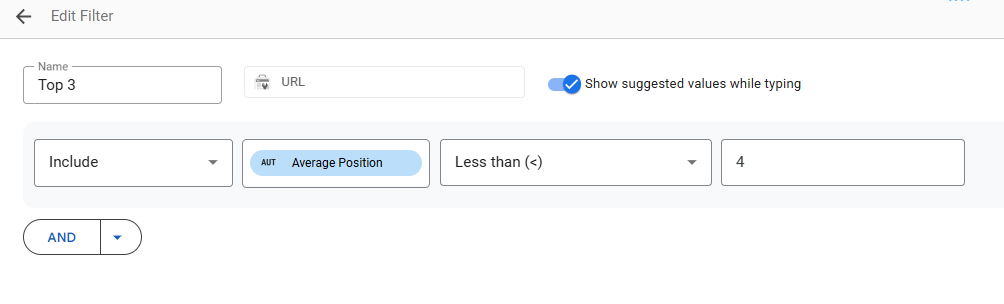
Filters to get Top 3, 10, and 20 keywords respectively.
Above filters are for clicks of different device categories.
Brand Vs Generic Section: Divided into three tabs
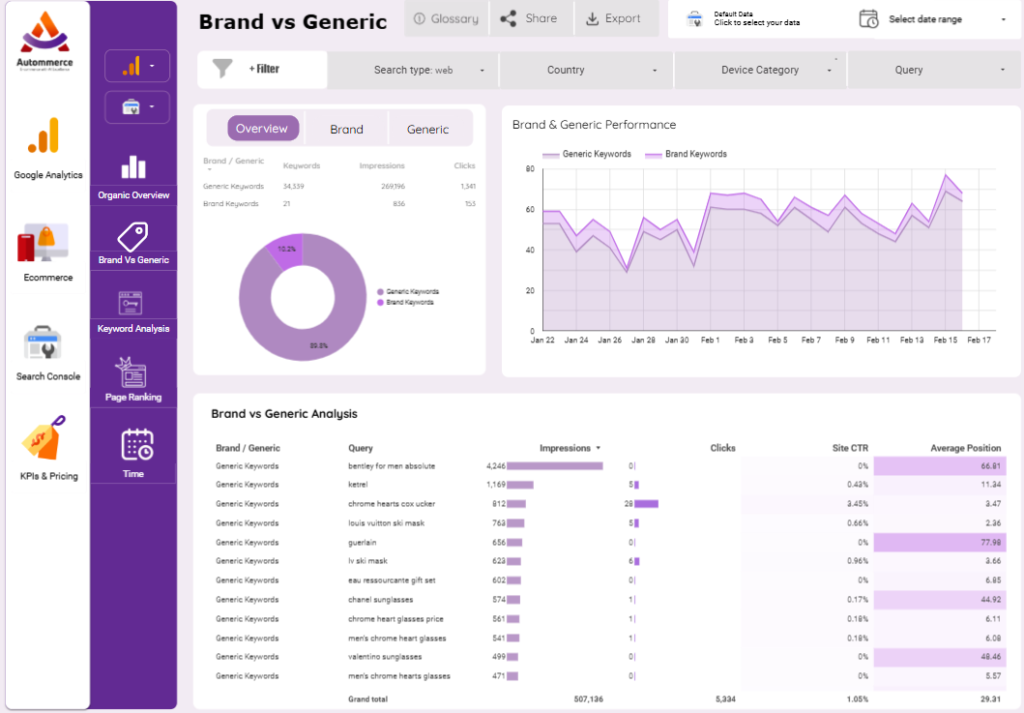
Brand vs Generic Overview Tab
The Brand vs Generic Overview tab compares the performance of branded and generic keywords. This helps to understand the impact of brand awareness versus general product search terms on website traffic.
- Table: Show the number of branded and generic keywords, impressions, and clicks. This provides a snapshot of how each keyword type contributes to overall visibility and engagement (make new dimension Brand / Generic to distinguish between brand and generic keywords).
- Pie Chart: Displays the percentage share of branded versus generic keywords, highlighting the dominant keyword type.
- Line Chart: Tracks the performance of branded and generic keywords over time, allowing for trend analysis and seasonality insights.
- Analysis Table: Lists the top-performing queries with impressions, clicks, CTR, and average position, offering detailed insights into the effectiveness of each keyword.
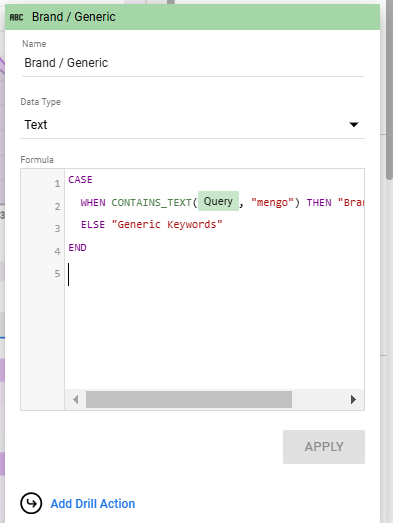
CASE
WHEN CONTAINS_TEXT (Query, “mengo”) THEN “Brand Keywords”
ELSE “Generic Keywords”
END
Brand Keyword Change According to your website.
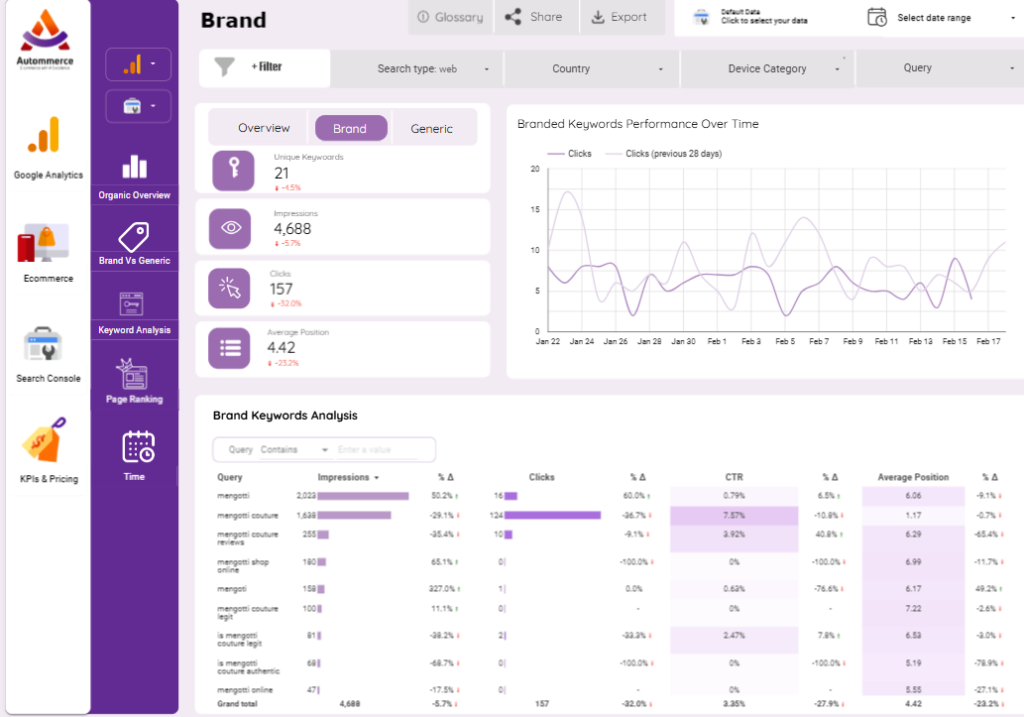
Brand Tab
The Brand tab focuses on keywords that include the brand name, reflecting brand loyalty and awareness. It evaluates the effectiveness of branded searches in driving traffic and engagement.
- Scorecards: Present key metrics such as unique branded keywords, impressions, clicks, and average position. This illustrates the visibility and engagement driven by brand-specific searches.
- Line Chart: Shows the performance of branded keywords over time, highlighting spikes or drops in brand interest.
- Analysis Table: Details branded keyword queries with impressions, clicks, CTR, and average position, helping to identify the most effective branded terms.
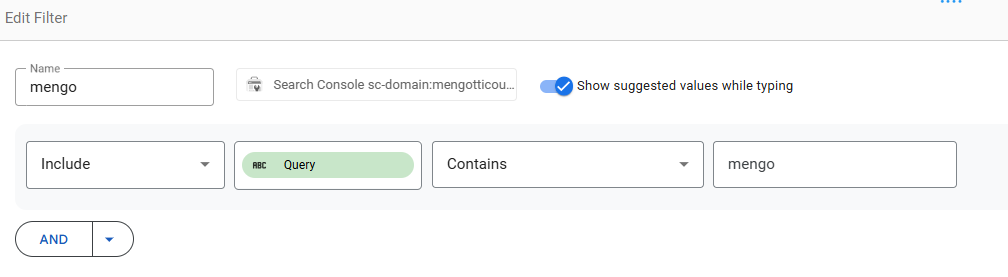
* Make filter for the whole charts in this page where Query include only the brand keyword.
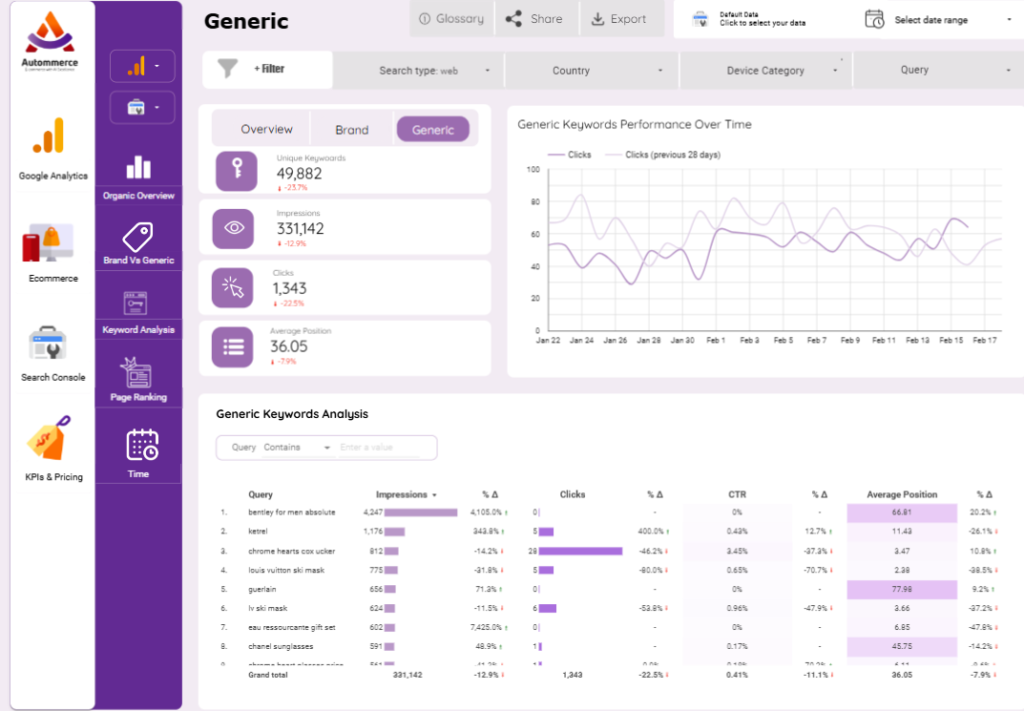
Generic Tab
The Generic tab examines keywords that do not include the brand name, representing broader product searches and potential new customer acquisition.
- Scorecards: Display metrics for unique generic keywords, impressions, clicks, and average position. This measures the effectiveness of non-branded searches in driving organic traffic.
- Line Chart: Tracks the performance of generic keywords over time, providing insights into seasonal trends and shifts in consumer behavior.
- Analysis Table: Lists top generic keyword queries with impressions, clicks, CTR, and average position, allowing for the identification of high-performing generic terms.
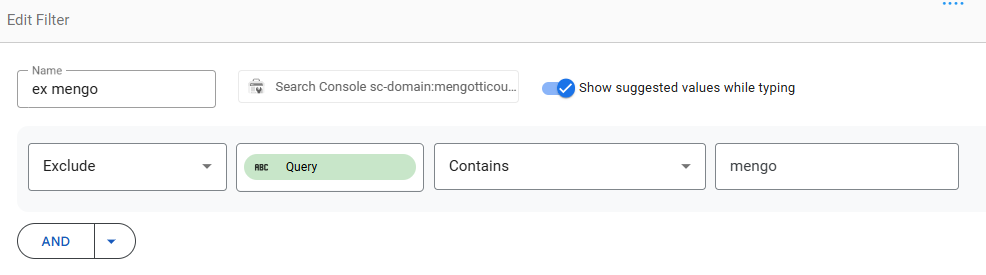
* Make filter for the whole charts in this page where Query exclude the brand keyword.
Keyword Analysis Section: Divided into three tabs
The Keyword Analysis Section provides a detailed evaluation of keyword performance, focusing on the impact of short-tail and long-tail keywords. It is divided into three tabs: Overview, Short Tail, and Long Tail.
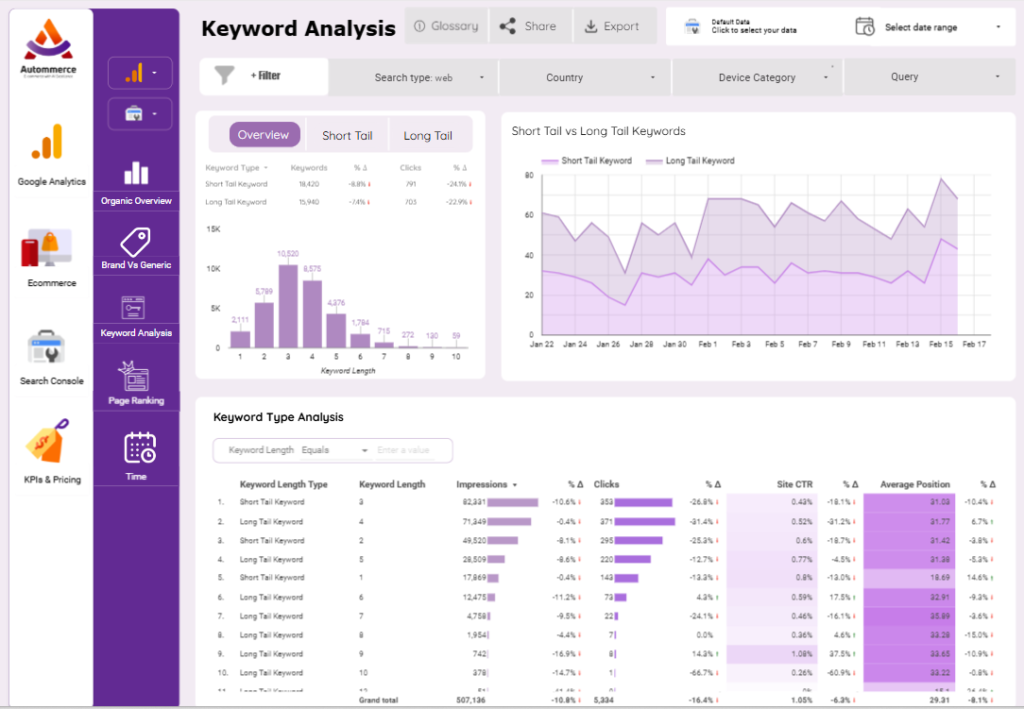
Overview Tab
- Purpose:
- This tab offers a comprehensive comparison of short-tail and long-tail keyword performance.
- Key Components:
- Scorecards: Display key metrics such as the total number of keywords, impressions, clicks, and average position for both short-tail and long-tail keywords.
- Bar Chart: Shows the distribution of keywords by length, illustrating how keyword length impacts impressions and clicks.
- Line Chart: Compares the performance trends of short-tail and long-tail keywords over time, highlighting changes in clicks and visibility.
- Keyword Type Analysis: Provides a detailed breakdown of keyword queries, including impressions, clicks, CTR, and average position, categorized by keyword length and type.
*Create two new fields/ dimensions which are keyword type to classify keywords into long and short tail keywords, and Keyword length to get the length of each query.
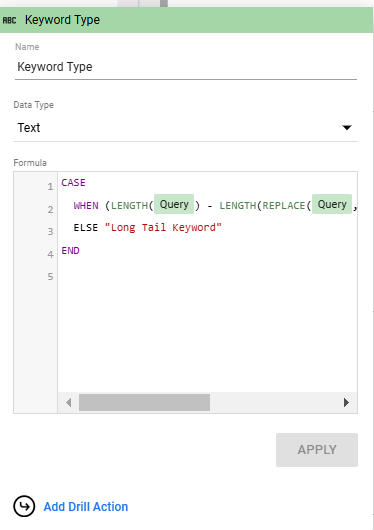
CASE
WHEN (LENGTH(Query) – LENGTH(REPLACE(Query, ” “, “”)) + 1) <= 3 THEN “Short Tail Keyword”
ELSE “Long Tail Keyword”
END
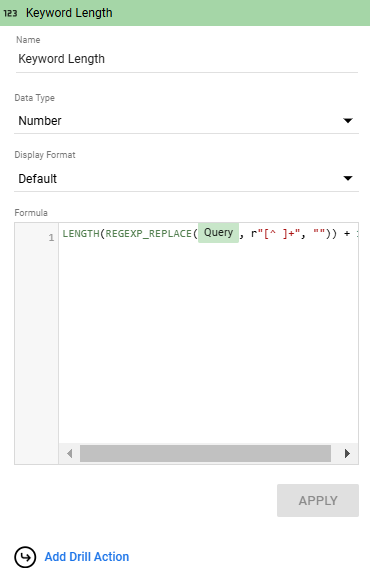
LENGTH(REGEXP_REPLACE(Query, r”[^ ]+”, “”)) + 1
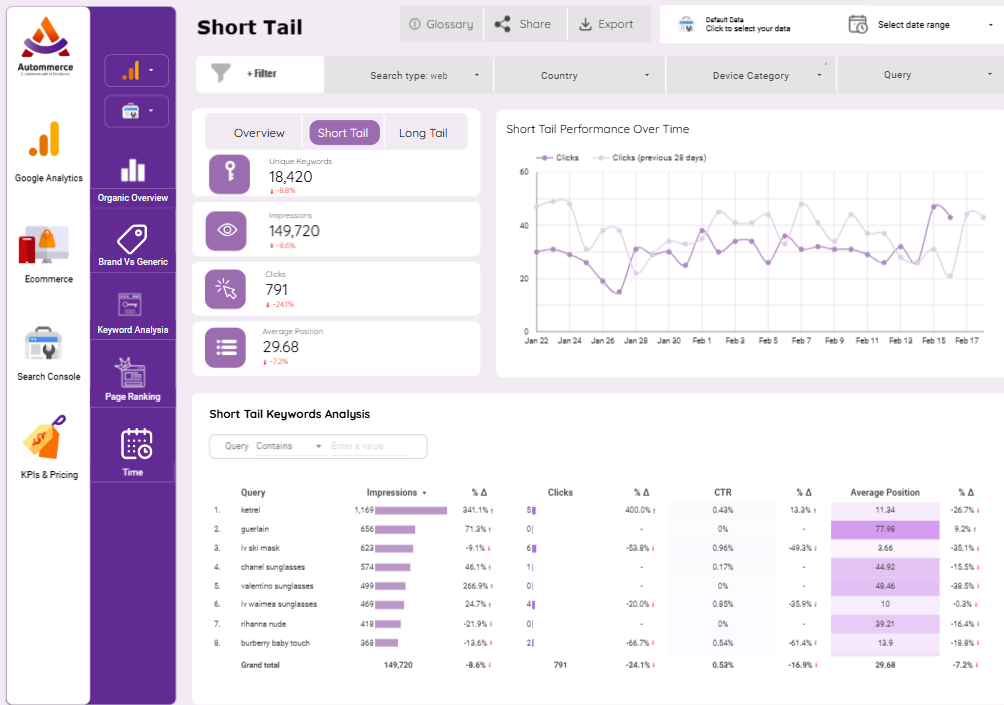
Short Tail Tab
- Purpose:
- Focuses on short-tail keywords, which are typically 1-3 words long and have high search volume but lower specificity.
- Key Components:
- Scorecards: Display key metrics such as unique keywords, impressions, clicks, and average position for short-tail terms.
- Performance Over Time Chart: Visualizes the click trends for short-tail keywords, comparing the current period with the previous 28 days.
- Short Tail Keywords Analysis: Offers a detailed view of short-tail queries, including impressions, clicks, CTR, and average position.
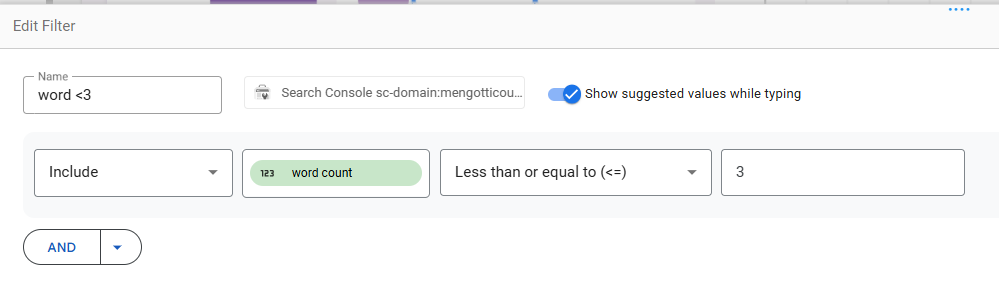
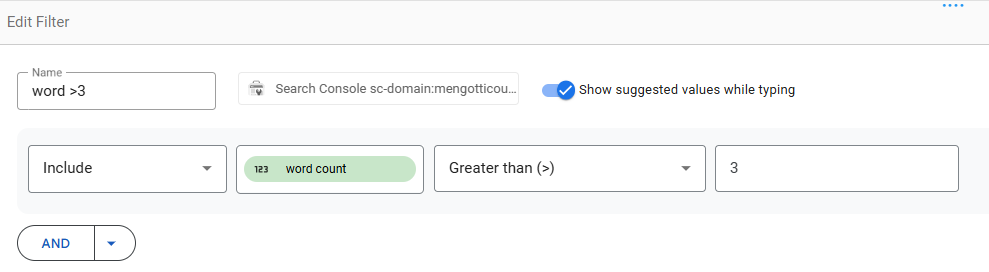
*Make new field Word count and filter the whole charts with word count <= 3 (the field is the same as keyword length).
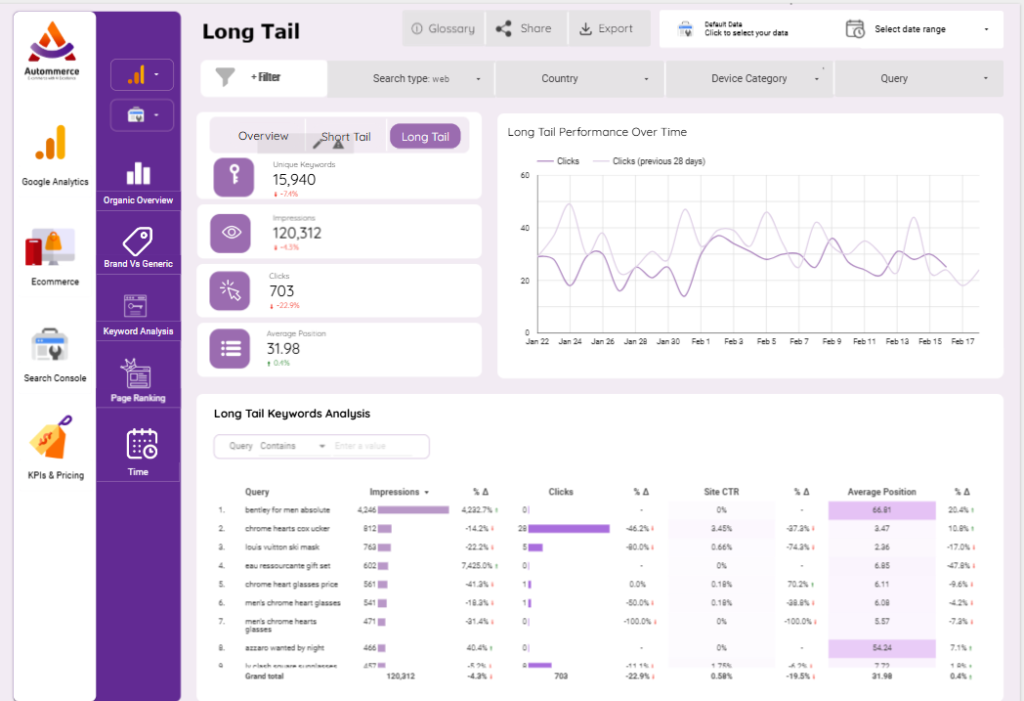
Long Tail Tab
- Purpose:
- Analyzes long-tail keywords, which are typically longer, more specific phrases with lower search volume but higher conversion potential.
- Key Components:
- Scorecards: Present key metrics such as unique keywords, impressions, clicks, and average position for long-tail terms.
- Performance Over Time Chart: Tracks the click trends for long-tail keywords, comparing the current period with the previous 28 days.
- Long Tail Keywords Analysis: Provides a detailed breakdown of long-tail queries, including impressions, clicks, CTR, and average position.
*Make new field Word count and filter the whole charts with word count > 3 (the field is the same as keyword length).
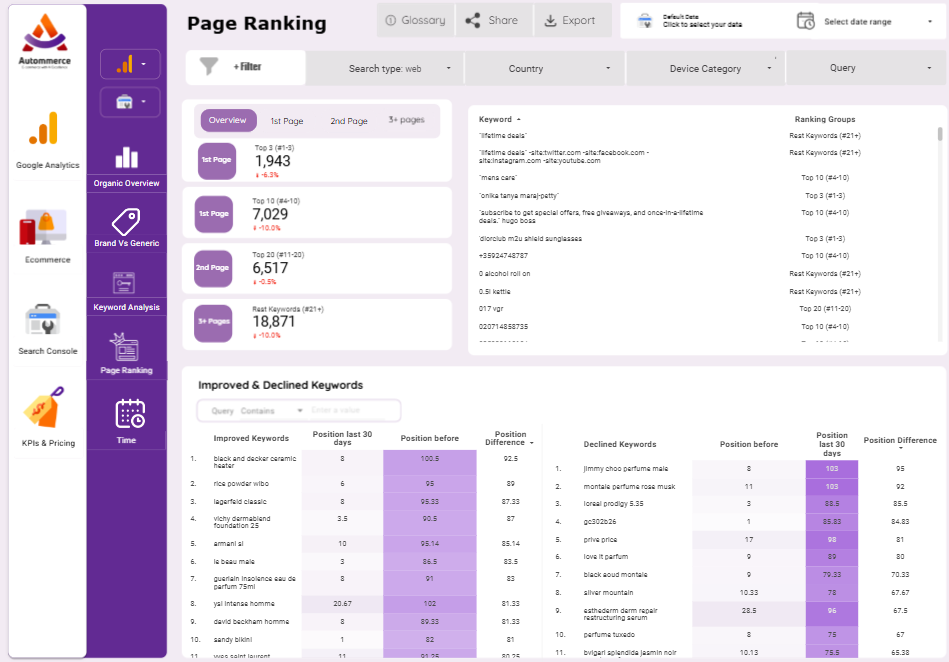
Page Ranking Section
The Page Ranking section provides insights into keyword positions, identifying opportunities to improve search visibility. It is divided into four tabs: Overview, 1st Page, 2nd Page, and 3+ Pages, each focusing on different keyword performance segments.
Overview Tab
- Purpose: Offers a comprehensive snapshot of keyword positions across all ranking pages.
- Components:
- Scorecards: Show the total number of keywords in different ranking groups, including:
- Top 3 (1-3): High visibility and traffic potential.
- Top 10 (4-10): Competitive positions with growth potential.
- Top 20 (11-20): Opportunities to move to the first page.
- Rest Keywords (21+): Keywords needing strategic improvement.
- Keyword List: Displays a selection of notable keywords and their ranking groups.
- Improved & Declined Keywords: Highlights the most significant position changes, helping identify content optimization successes and challenges.
- Scorecards: Show the total number of keywords in different ranking groups, including:
* Use previous filters and blended data for Top 3, 10, 20 Keywords and add blended data for rest keywords.
*Make blend data to get average position last 30 days and previous period to get improved and declined Keywords and Make position difference fields.
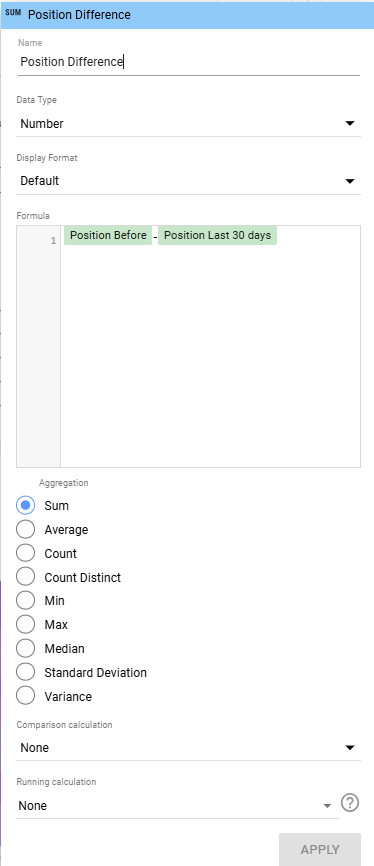
For Improved Keywords
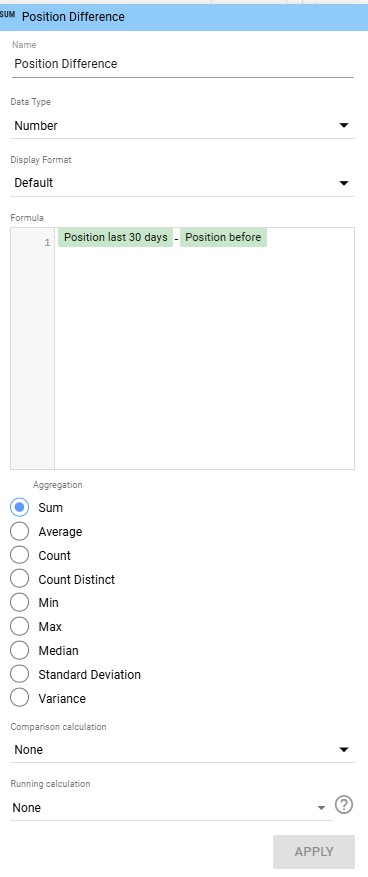
For Declined Keywords
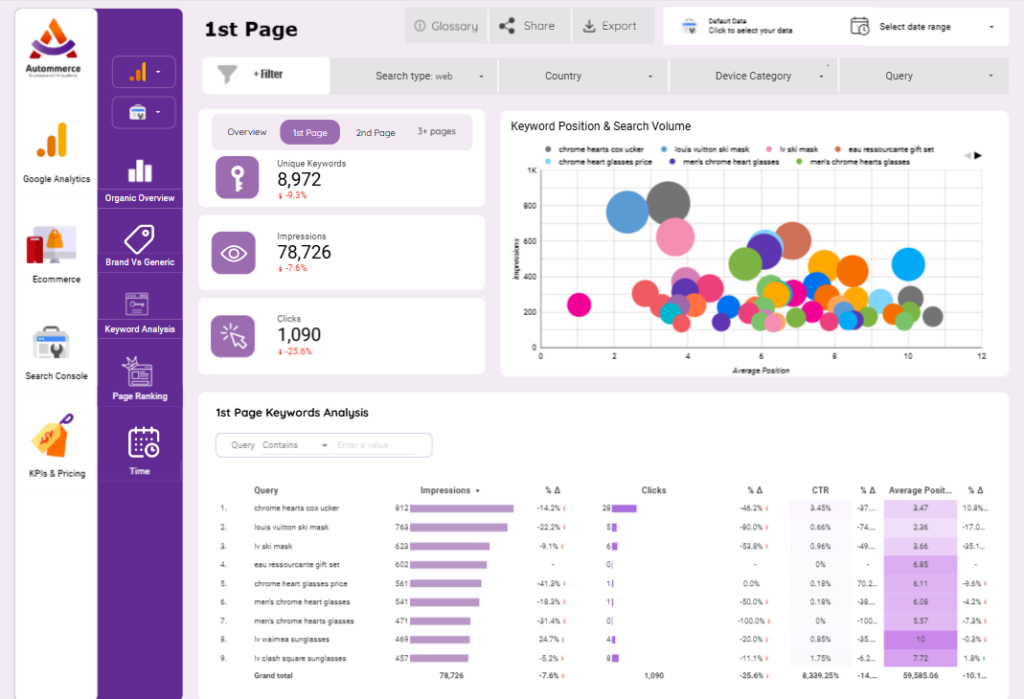
1st Page Tab
- Purpose: Analyzes keywords ranking on the first page (positions 1-10) for high visibility.
- Components:
- Scorecards: Show key metrics for 1st-page keywords, including:
- Unique Keywords: Number of keywords on the first page.
- Impressions: Visibility in search results.
- Clicks: User engagement.
- Keyword Position & Search Volume Chart:
- Visualizes keyword positions against search volume.
- Identifies high-potential keywords with high search volume but lower ranking positions.
- 1st Page Keywords Analysis:
- Detailed breakdown of keywords, impressions, clicks, click-through rate (CTR), and average position.
- Provides insights into which keywords are driving the most traffic and engagement.
- Scorecards: Show key metrics for 1st-page keywords, including:
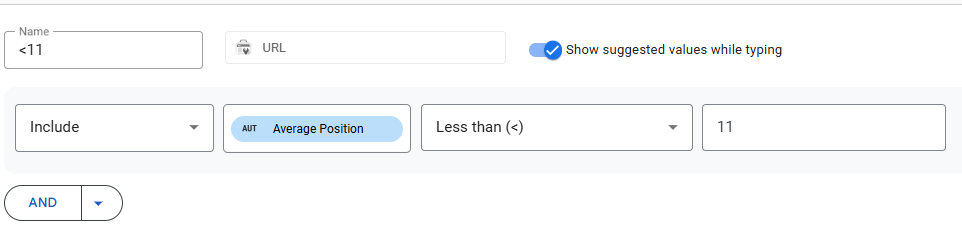
*For 1st page we make blended data for average position < 11.
2nd Page Tab
- Purpose: Examines keywords ranking on the second page (positions 11-20), offering opportunities to move to the first page.
- Components:
- Scorecards: Include metrics for 2nd-page keywords:
- Unique Keywords: Number of keywords on the second page.
- Impressions: Search visibility.
- Clicks: User interactions.
- Keyword Position & Search Volume Chart:
- Shows the potential for keywords to move to the first page.
- Highlights keywords with high search volume but low CTR.
- 2nd Page Keywords Analysis:
- Detailed keyword metrics, helping prioritize optimizations for keywords on the verge of first-page ranking.
- Scorecards: Include metrics for 2nd-page keywords:
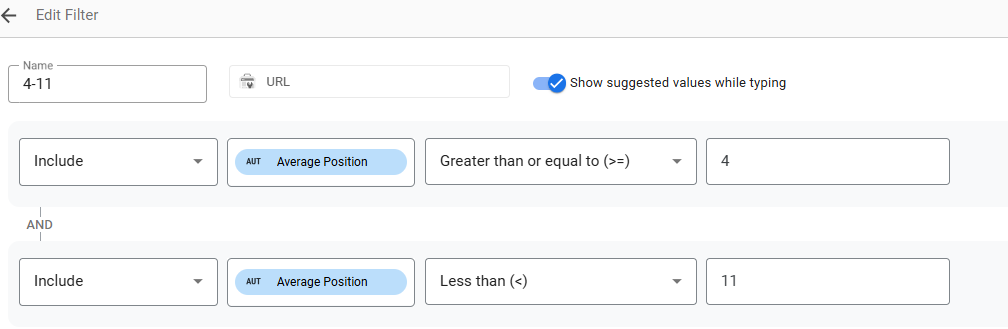
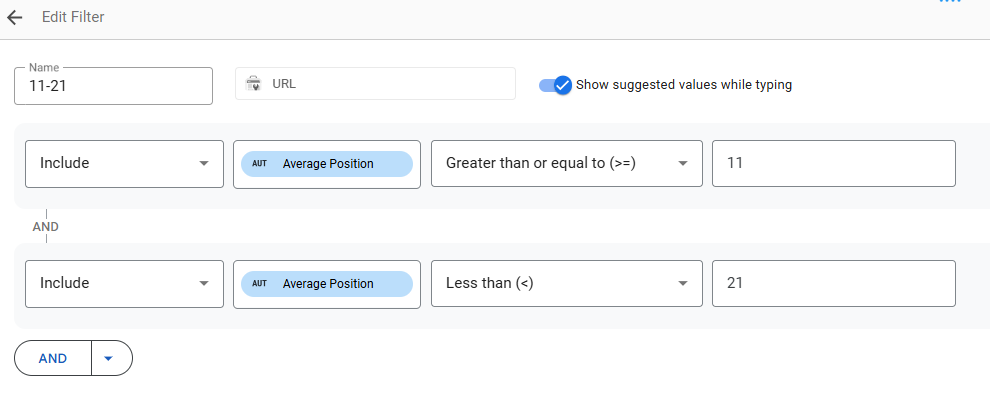
*For 2nd page we keep same blended data for average position between 11 & 21 and we can add the metrics we need.
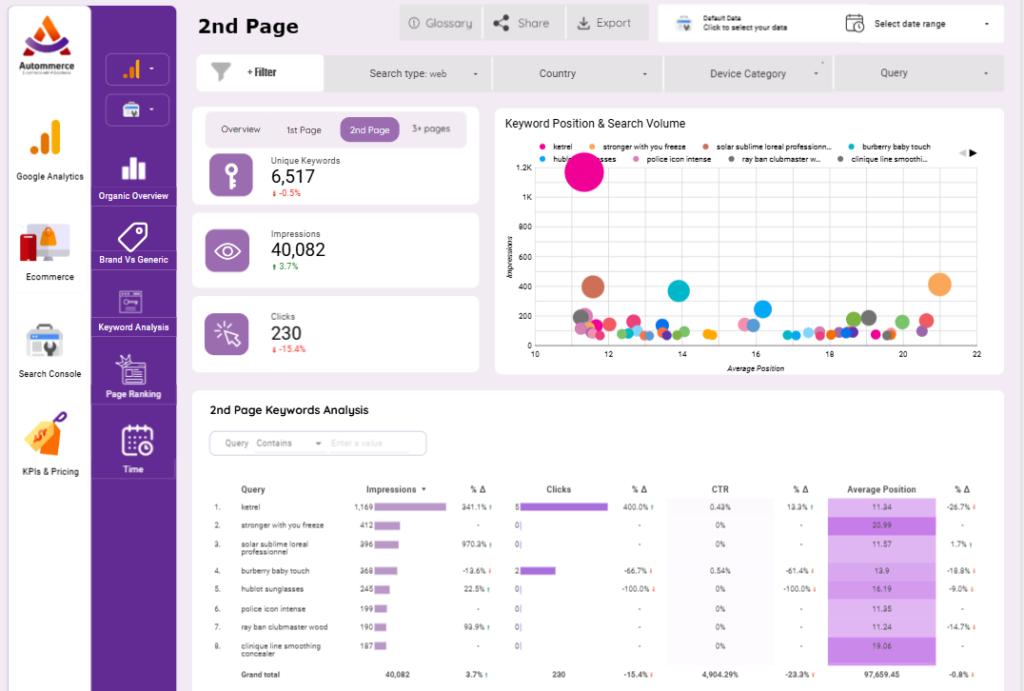
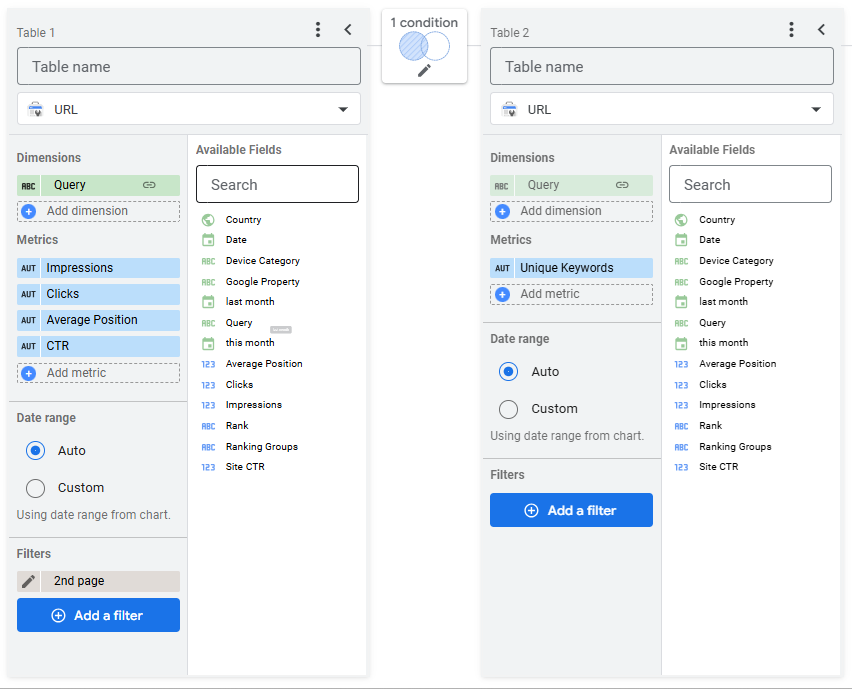
The filter is the same as the previous 11_21
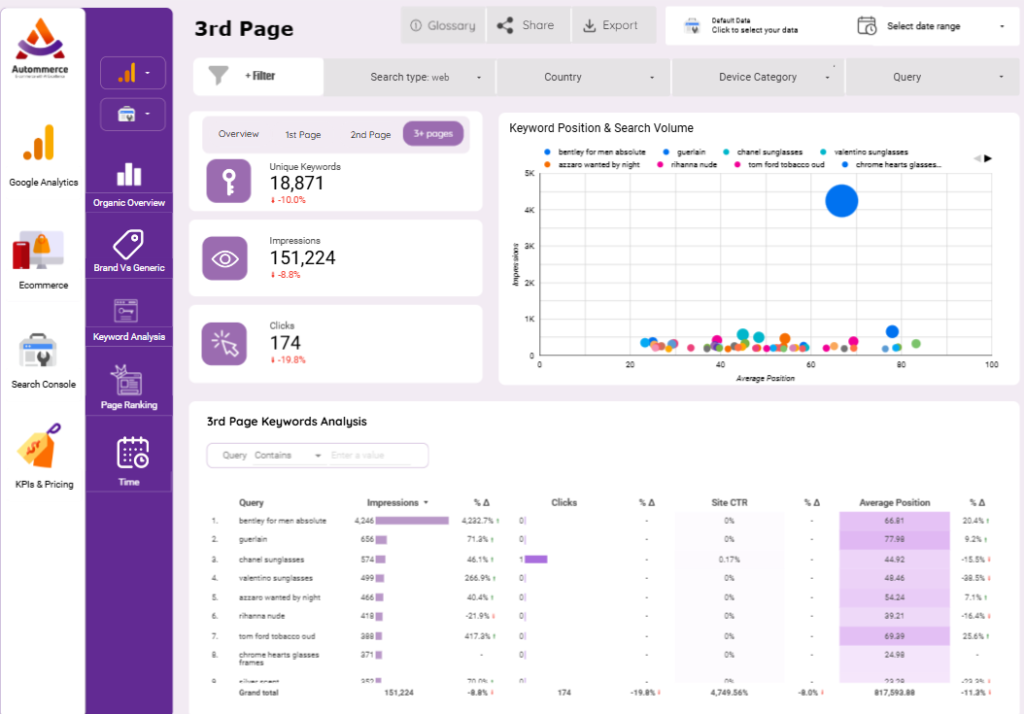
3+ Pages Tab
- Purpose: Focuses on keywords ranking beyond the second page, identifying long-term growth opportunities.
- Components:
- Scorecards: Display metrics for keywords on the third page and beyond:
- Unique Keywords: Total keywords beyond the second page.
- Impressions: Visibility in search results.
- Clicks: User engagement levels.
- Keyword Position & Search Volume Chart:
- Shows the distribution of low-ranking keywords.
- Identifies high-volume keywords that need significant SEO efforts.
- 3rd Page Keywords Analysis:
- Provides detailed metrics to identify underperforming keywords with the potential for growth through targeted SEO strategies.
- Scorecards: Display metrics for keywords on the third page and beyond:
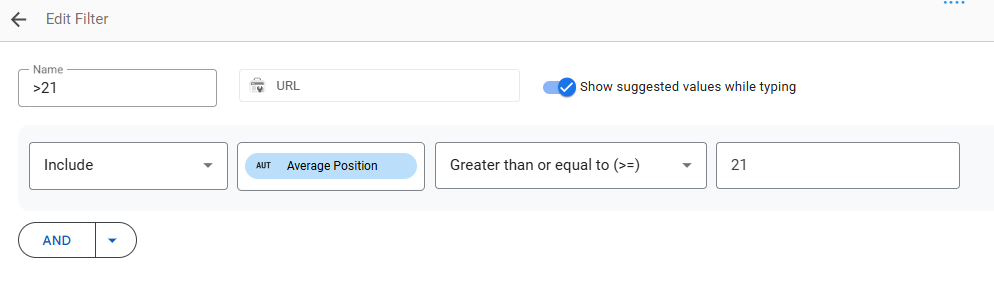
*For 3rd page we keep same blended data for average position between >= 21 and we can add the metrics we need.
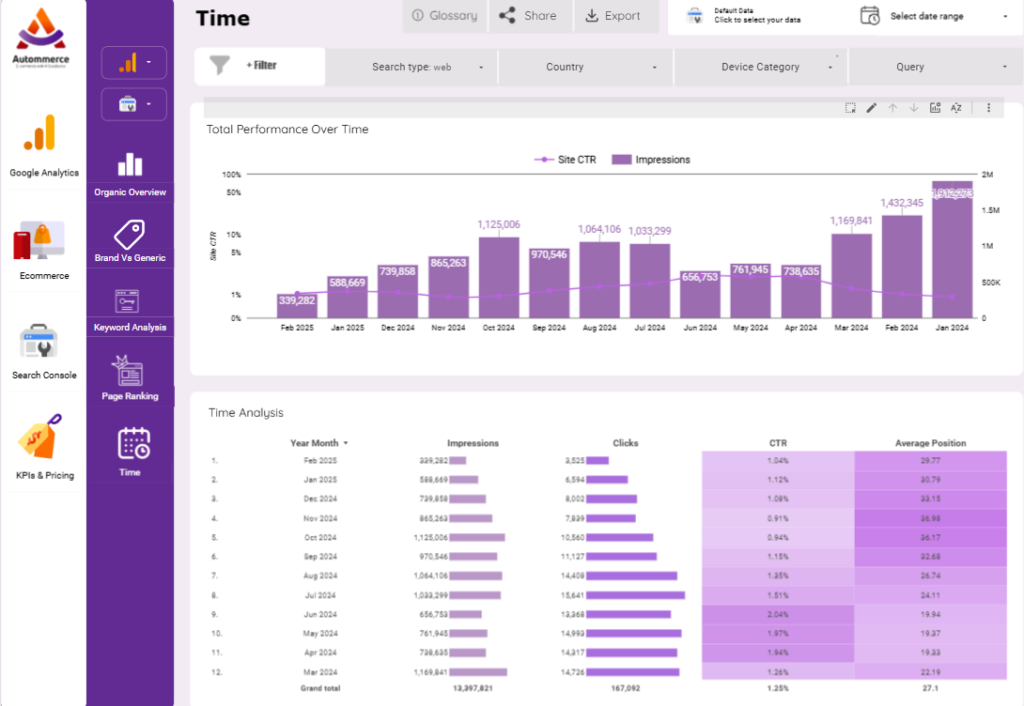
Time Section
The Time section tracks SEO performance metrics over time, enabling the analysis of trends and seasonal patterns. It helps understand how impressions, clicks, click-through rates (CTR), and average position evolve over months.
Total Performance Over Time
- Purpose: Shows the monthly evolution of key SEO metrics, helping identify patterns or anomalies.
- Components:
- Bar Chart (Impressions & CTR):
- Impressions: Represent the number of times the website appeared in search results.
- Site CTR: Percentage of users who clicked on the website after seeing it in search results.
- This combined view helps analyze if increased visibility translates into higher engagement.
- Trend Analysis:
- Identifies seasonal peaks or drops, assisting in strategic planning for content and campaigns.
- Useful for comparing performance across different time frames.
- Bar Chart (Impressions & CTR):
KPIs & Pricing Sections
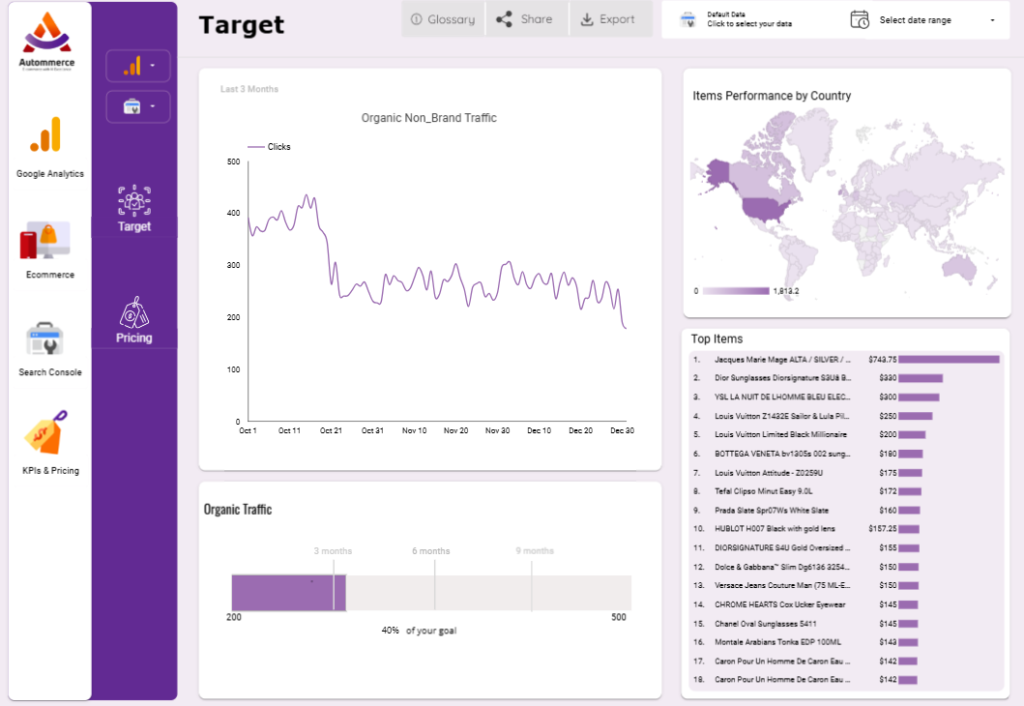
Target Section Overview
The Target section tracks organic non-brand traffic and its progress towards set goals. It helps evaluate regional performance and top-selling products to guide marketing strategies.
Key Components:
- Organic Non-Brand Traffic: Monitors traffic trends to assess SEO effectiveness.
- Items Performance by Country: Maps revenue by region to identify top markets.
- Top Items: Ranks best-selling products for marketing and inventory insights.
- Goal Progress: Tracks achievement of organic traffic targets.
*For goal progress add stacked bar chart add two metrics, one is actual value (clicks post SEO till today), and one is Goal (add parameter with the goal you put).
*In the scorecard below the previous chart make new field with data type percent (Actual Value/Goal *100)
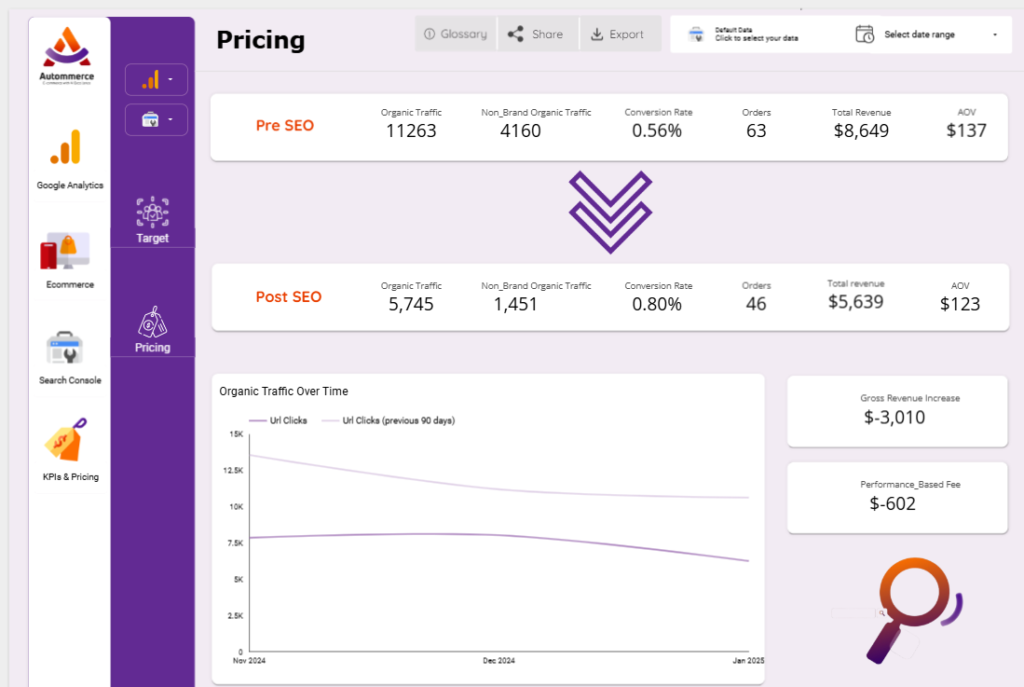
Pricing Section Overview
The Pricing section evaluates the financial impact of SEO efforts by comparing pre- and post-SEO performance. It highlights changes in traffic, conversion rate, orders, and revenue, helping assess SEO effectiveness and pricing strategies.
Key Components:
- Pre-SEO vs. Post-SEO Comparison: Shows differences in organic traffic, conversion rates, and revenue.
- Organic Traffic Over Time: Tracks traffic trends to visualize SEO impact.
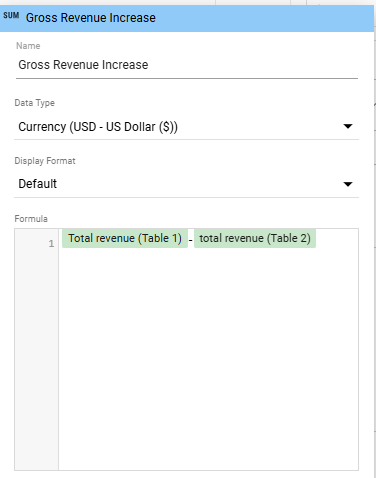
- Gross Revenue Increase: Displays revenue changes due to SEO efforts.
- Performance-Based Fee: Calculates fees based on revenue performance.
*In Pre-SEO select date range 6 months pre-SEO and divide each metric into 6.
*Organic Traffic is Clicks/6 pre-SEO and clicks post SEO.
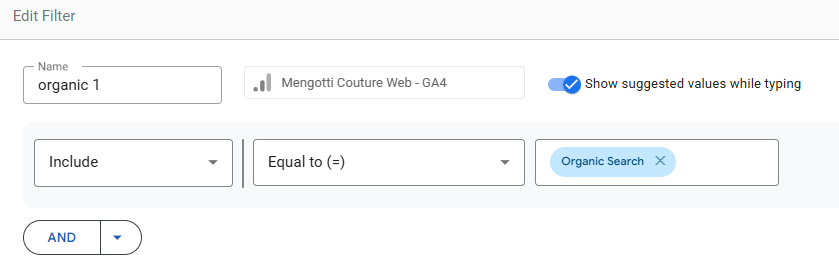
*For non-brand organic traffic add the filter made previously to exclude brand keyword
*Add new field conversion Rate (Transactions / Clicks)
*Add new field AOV (Total revenue/ Transactions)
*Post SEO Data are for last 30 days
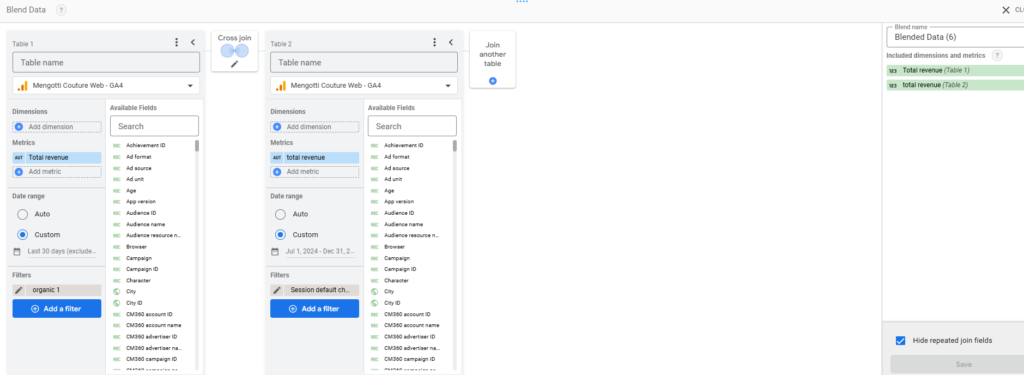
*For Gross Revenue Increase make blended data
* Performance Based Fee is 20% of Gross Revenue Increase (Create new field of gross revenue increase same blended data: (Total revenue (Table 1)-total revenue (Table 2))*(20/100)).